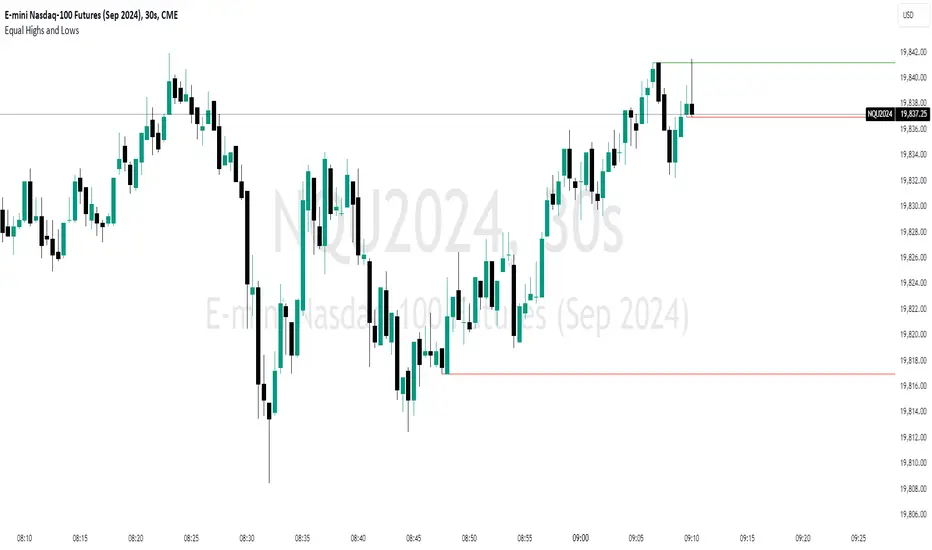
Equal Highs and LowsDescription:
The ‘Equal Highs and Lows’ indicator is a technical analysis tool that marks identical price levels on a trading chart using the current time-frame, assisting traders in identifying potential support and resistance zones or liquidity draws. It creates a horizontal line connecting points where the price has created equal highs and lows within a specified lookback period. Unique to this tool, it maintains a clean chart by removing the line once the price surpasses the equal highs or falls below the equal lows, ensuring only the currently relevant equal highs and lows are highlighted.
Features:
Customization Options: Users can adjust the appearance of the lines (color, width, and style) to match their chart setup or preferences. Users can also choose to extend the lines marking the equal highs/lows to the right of the chart making the equal high/low levels more easier to visualize.
User-Defined Lookback Length: The number of bars to look back for finding equal highs and lows can be set by the user, allowing for flexibility in different market conditions.
How It Works:
The indicator meticulously scans the chart over a user-specified lookback duration, identifying bars with matching high or low values that have not been mitigated on the current chat timeframe, thereby constructing an index of equal values. It subsequently connects these equal values on the chart with a line. While this intuitive indicator does not forecast future market trends, it emphasizes significant price levels derived from historical data.
Usage:
Identifying Support and Resistance: The lines drawn by the indicator can be used to identify potential support and resistance zones and/or draws of liquidity, which are crucial for making informed trading decisions.
Strategy Development: Traders can incorporate the visual cues provided by the indicator into their trading strategies, using them as one of the factors for entry or exit decisions.
Originality:
This indicator presents a distinctive method for pinpointing and illustrating equal highs and lows, granting traders a crucial insight into key price levels. It stands apart from conventional indicators by offering extensive personalization and employing a novel approach to augment chart analysis. Uniquely, it retains only unmitigated equal high/low levels on the chart, automatically discarding mitigated price levels once the price has reached that level.
Conclusion:
The "Equal Highs and Lows" indicator is a practical tool for traders looking to enhance their chart analysis with visual cues of significant price levels. Its customization options and innovative approach make it a valuable addition to the trading toolkit, suitable for various trading styles and strategies.
Cerca negli script per "high low"
Depth of Market (DOM) [LuxAlgo]The Depth Of Market (DOM) tool allows traders to look under the hood of any market, taking price and volume analysis to the next level. The following features are included: DOM, Time & Sales, Volume Profile, Depth of Market, Imbalances, Buying Pressure, and up to 24 key intraday levels (it really packs a punch).
As a disclaimer, this tool does not use tick data, it is a DOM reconstruction from the provided real-time time series data (price and volume). So the volume you see is from filled orders only, this tool does not show unfilled limit orders.
Traders can enable or disable any of the features at will to avoid being overwhelmed with too much information and to make the tool perform faster.
The features that have the biggest impact on performance are Historical Data Collection, Key Levels (POC & VWAP), Time & Sales, Profile, and Imbalances. Disable these features to improve the indicator computational performance.
🔶 DOM
This is the simplest form of the tool, a simple DOM or ladder that displays the following columns:
PRICE: Price level
BID: Total number of market sell orders filled or limit buy orders filled.
SELL: Sell market orders
BUY: Buy market orders
ASK: Total number of market buy orders filled or limit sell orders filled.
The DOM only collects historical data from the last 24 hours and real-time data.
Traders can select a reset period for the DOM with two options:
DAILY: Resets at the beginning of each trading day
SESSIONS: Resets twice, as DAILY and 15.5 hours later, to coincide with the start of the RTH session for US tickers.
The DOM has two main modes, it can display price levels as ticks or points. The default is automatic based on the current daily volatility, but traders can manually force one mode or the other if they wish.
For convenience, traders have the option to set the number of lines (price levels), and the size of the text and to display only real-time data.
By default, the top price is set to 0 so that the DOM automatically adjusts the price levels to be displayed, but traders can set the top price manually so that the tool displays only the desired price levels in a fixed manner.
🔹 Volume Profile
As additional features to the basic DOM, traders have access to the volume profile histogram and the total volume per price level.
This helps traders identify at a glance key price areas where volume is accumulating (high volume nodes) or areas where volume is lacking (low volume nodes) - these areas are important to some traders who base their decision-making process on them.
🔹 Imbalances
Other added features are imbalances and buying pressure:
Interlevel Imbalance: volume delta between two different price levels
Intralevel Imbalance: delta between buy and sell volume at the same price level
Buying Pressure Percent: percentage of buy volume compared to total volume
Imbalances can help traders identify areas of interest in the price for possible support or resistance.
🔹 Depth
Depth allows traders to see at a glance how much supply is above the current price level or how much demand is below the current price level.
Above the current price level shows the cumulative ask volume (filled sell limit orders) and below the current price level shows the cumulative bid volume (filled buy limit orders).
🔶 KEY LEVELS
The tool includes up to 24 different key intraday levels of particular relevance:
Previous Week Levels
PWH: Previous week high
PWL: Previous week low
PWM: Previous week middle
PWS: Previous week settlement (close)
Previous Day Levels
PDH: Previous day high
PDL: Previous day low
PDM: Previous day middle
PDS: Previous day settlement (close)
Current Day Levels
OPEN: Open of day (or session)
HOD: High of day (or session)
LOD: Low of day (or session)
MOD: Middle of day (or session)
Opening Range
ORH: Open range high
ORL: Open range low
Initial Balance
IBH: Initial balance high
IBL: Initial balance low
VWAP
+3SD: Volume weighted average price plus 3 standard deviations
+2SD: Volume weighted average price plus 2 standard deviations
+1SD: Volume weighted average price plus 1 standard deviation
VWAP: Volume weighted average price
-1SD: Volume weighted average price minus 1 standard deviation
-2SD: Volume weighted average price minus 2 standard deviations
-3SD: Volume weighted average price minus 3 standard deviations
POC: Point of control
Different traders look at different levels, the key levels shown here are objective and specific areas of interest that traders can act on, providing us with potential areas of support or resistance in the price.
🔶 TIME & SALES
The tool also features a full-time and sales panel with time, price, and size columns, a size filter, and the ability to set the timezone to display time in the trader's local time.
The information shown here is what feeds the DOM and it can be useful in several ways, for example in detecting absorption. If a large number of orders are coming into the market but the price is barely moving, this indicates that there is enough liquidity at these levels to absorb all these orders, so if these orders stop coming into the market, the price may turn around.
🔶 SETTINGS
Period: Select the anchoring period to start data collection, DAILY will anchor at the start of the trading day, and SESSIONS will start as DAILY and 15.5 hours later (RTH for US tickers).
Mode: Select between AUTO and MANUAL modes for displaying TICKS or POINTS, in AUTO mode the tool will automatically select TICKS for tickers with a daily average volatility below 5000 ticks and POINTS for the rest of the tickers.
Rows: Select the number of price levels to display
Text Size: Select the text size
🔹 DOM
DOM: Enable/Disable DOM display
Realtime only: Enable/Disable real-time data only, historical data will be collected if disabled
Top Price: Specify the price to be displayed on the top row, set to 0 to enable dynamic DOM
Max updates: Specify how many times the values on the SELL and BUY columns are accumulated until reset.
Profile/Depth size: Maximum size of the histograms on the PROFILE and DEPTH columns.
Profile: Enable/Disable Profile column. High impact on performance.
Volume: Enable/Disable Volume column. Total volume traded at price level.
Interlevel Imbalance: Enable/Disable Interlevel Imbalance column. Total volume delta between the current price level and the price level above. High impact on performance.
Depth: Enable/Disable Depth, showing the cumulative supply above the current price and the cumulative demand below. Impact on performance.
Intralevel Imbalance: Enable/Disable Intralevel Imbalance column. Delta between total buy volume and total sell volume. High impact on performance.
Buying Pressure Percent: Enable/Disable Buy Percent column. Percentage of total buy volume compared to total volume.
Imbalance Threshold %: Threshold for highlighting imbalances. Set to 90 to highlight the top 10% of interlevel imbalances and the top and bottom 10% of intra-level imbalances.
Crypto volume precision: Specify the number of decimals to display on the volume of crypto assets
🔹 Key Levels
Key Levels: Enable/Disable KEY column. Very high performance impact.
Previous Week: Enable/Disable High, Low, Middle, and Close of the previous trading week.
Previous Day: Enable/Disable High, Low, Middle, and Settlement of the previous trading day.
Current Day/Session: Enable/Disable Open, High, Low and Middle of the current period.
Open Range: Enable/Disable High and Low of the first candle of the period.
Initial Balance: Enable/Disable High and Low of the first hour of the period.
VWAP: Enable/Disable Volume-weighted average price of the period with 1, 2, and 3 standard deviations.
POC: Enable/Disable Point of Control (price level with the highest volume traded) of the period.
🔹 Time & Sales
Time & Sales: Enable/Disable time and sales panel.
Timezone offset (hours): Enter your time zone\'s offset (+ or −), including a decimal fraction if needed.
Order Size: Set order size filter. Orders smaller than the value are not displayed.
🔶 THANKS
Hi, I'm makit0 coder of this tool and proud member of the LuxAlgo Opensource team, it's an honor to be part of the LuxAlgo family doing something I love as it's writing opensource code and sharing it with the world. I'd like to thank all of you who use, comment on, and vote for all of our open-source tools, and all of you who give us your support.
And of course thanks to the PineCoders family for all the work in front of and behind the scenes that makes the PineScript community what it is, simply the best.
Peace, Love & PineScript!

True Market Structure {DCAquant}
True Market Structure
Overview
The True Market Structure is a technical analysis tool designed for use across all timeframes. It identifies and visualizes market structure breaks (MSBs) and break of structure (BOS) events, emphasizing interim highs and lows using the "Deroz Wick" system. Unlike many other indicators, this tool does not rely on traditional pivot points, making it a unique addition to any trader's toolkit.
How It Works
The True Market Structure indicator uses a combination of algorithms to detect and highlight significant market structure events. By analyzing price action and identifying key levels, the indicator aids in understanding potential reversal points and trend continuations.
Bull and Bear Market Structures: Differentiates between bullish and bearish market structures, applying distinct color settings for easy visualization.
Customizable Settings: Users can tailor the indicator’s appearance and functionality to their preferences, including toggling lines, labels, and selecting between SWING and INTERIM MS settings.
How our market structure indicator is different
All known market structure indicators work with pivot points. This is a lookback function to find highs and lows within a certain period and then producing market structure.
Our indicator doesn't work like this as the DCAquant True Market Structure finds swing and interim lows and saves it into memory thus giving us the ability to create real market structure breaks and BOS’s.
This is achieved when an MSB or BOS is triggered the script will perform a check through its memory to find previous Interim or swing which ever setting the user has selected.
A saved interim or swing will never change unless it is broken giving you true market structure, this Indicator cannot repaint because it only produces breaks whenever candle is closed.
The next MSB or BOS you see on the chart are the direct function of saved memory points which gives clear indication of true market structure.
Almost 500 lines of code to give you True Market Structure usable on any timeframe.
Key Features
1. Market Structure Breaks (MSBs) and Break of Structure (BOS)
Market Structure Breaks (MSBs): Occur when the price breaks through a previous significant high or low, indicating a potential reversal or continuation of the current trend.
Break of Structure (BOS): Highlights significant breaks in market structure, providing insights into potential trend changes.
2. Visualization Options
Customizable colour settings for both bull and bear market structures, ensuring it integrates with any chart setup.
Options to enable or disable lines and labels for flexible information display.
3. The WICK System
Standard WICK System: Identifies wicks based on standard high/low calculations.
Deroz WICK System: Enhances the standard WICK system by looking back at price history and replacing the standard wick if an even lower or higher wick is found in the subsequent bar.
4. MS Settings
SWING Setting: Sets future MSB events at swing highs/lows, offering a broader market perspective.
INTERIM Setting: Sets future MSB events at interim highs/lows, providing more immediate and frequent market structure updates.
Understanding Market Structure
Market structure is defined by a series of price actions that form recognizable patterns indicating the current trend. Key elements include:
Higher Highs (HH) and Higher Lows (HL): Indicate an uptrend, where each successive high and low is higher than the previous one.
Lower Highs (LH) and Lower Lows (LL): Indicate a downtrend, where each successive high and low is lower than the previous one.
These patterns help traders identify trend direction and potential reversal points. In an uptrend, traders look for higher highs and higher lows to continue, whereas in a downtrend, they look for lower highs and lower lows.
Application in Breakout Trading
Market structure analysis is crucial for breakout trading, where traders seek to capitalize on significant price movements following a break of established price levels.
Uptrend Breakouts: Traders watch for breaks above higher highs as potential entry points for long positions.
Downtrend Breakouts: Traders watch for breaks below lower lows as potential entry points for short positions.
The True Market Structure indicator assists by visually marking these critical levels, simplifying the process of identifying and acting on breakout opportunities.
Visual Representation
Indicator Settings
Standard WICK vs. Deroz WICK System:
Standard WICK
Deroz WICK
SWING MSB
INTERIM MSB
Summary
The True Market Structure indicator provides a clear and detailed view of market structure changes. By highlighting key MSB and BOS events and incorporating advanced wick detection through the Deroz WICK system, this tool can aid in making informed decisions based on a thorough understanding of market dynamics. However DCAquant recommends using this indicator as part of a system.

ZigZag ProHello Traders!
TRN ZigZag Pro is an indicator which identifies, and highlights pivot points (swings) and prints useful information about the swings in the chart (e.g. length, duration, ...). The indicator uses an extremely precise swing algorithm to detect the most important pivot points. Compared to other swing or zig-zag indicators TRN ZigZag Pro works in real-time, does not need a look-a-head to find swings and is not repainting. Moreover, equal (double) highs and lows are detected and displayed. The TRN ZigZag Pro helps traders to visualize pure price action and supports the trader to identify key turning points or trends.
The indicator comes with the following features:
Precise real-time swing detection without repainting
Equal/double high and low detection
Displaying of swing labels, values and information
Customizable settings as well as look and feel
It's important to note that the TRN ZigZag Pro is a visual tool and does not provide specific buy or sell signals. It serves as a guide for traders to analyze market structure in depth and make well-informed trading decisions based on their trading strategy and additional technical analysis.
Getting an edge with the TRN ZigZag Pro
The indicator clearly displays up trends, defined as a sequence of higher highs (HH) and higher lows (HL), with green labels and down trends, defined as a sequence of lower lows (LL) and lower highs (LH), with red labels. Equal highs/double tops (DT) and equal lows/ double bottoms (DB) are highlighted in gold.
In addition, the labels show a full stack of valuable information about the swings to maximize your accuracy.
Length
Length percentage in relation to the last swing length
Duration
Label (e.g. HH, LL...)
Use cases for swing detection
Trend Identification
By connecting the swing highs and lows, traders can identify and analyze the prevailing trend in the market. An uptrend is characterized by higher swing highs and lows, while a downtrend is characterized by lower highs and lower lows. The indicator helps traders visually to assess the strength and continuity of the trend.
Support And Resistance Levels
The swing highs and lows can act as support and resistance levels. Swing highs may act as resistance levels where selling pressure increases, while swing lows may act as support levels where buying pressure increases. Traders often pay attention to these levels as potential areas for trade entries, exits, or placing stop-loss orders.
Pattern Recognition
The swings identified by the indicator can help traders recognize chart patterns, such as equal high/lows, consolidations, wedges, triangles or more complex patterns like Gartley or Head and Shoulders. These patterns can provide insights into potential trend continuation or reversal.
Trade Entry and Exit
Traders may use TRN ZigZag Pro to determine potential trade entry and exit points. For example, in an uptrend, traders may look for opportunities to enter long positions near swing lows or on pullbacks to support levels. Conversely, in a downtrend, traders may consider short positions near swing highs or on retracements to resistance levels.
Conclusion
While signals from TRN ZigZag Pro can be informative, it is important to recognize that their reliability may vary. Various external factors can impact market prices, and it is essential to consider your risk tolerance and investment goals when executing trades.
Risk Disclaimer
The content, tools, scripts, articles, and educational resources offered by TRN Trading are intended solely for informational and educational purposes. Remember, past performance does not ensure future outcomes.

Quarterly DFR [Dango]Introducing the Defining Range Indicator, a powerful tool designed to help traders identify and understand the important levels of highs, lows, and equilibrium within a selected quarterly cycle. This innovative script provides valuable insights into the key price levels that are likely to elicit a strong reaction in the market, enabling traders to make more informed decisions and enhance their trading strategies.
Key Features:
Identifies and displays the defining high, low, and equilibrium levels based on the selected quarterly cycle
Utilizes advanced algorithms to analyze price action and determine the most significant levels
Provides a visual representation of the defining range on the chart, making it easy for traders to identify potential support, resistance, and pivot points
Enables traders to backtest and understand how price has reacted to these levels in the past
How It Works:
The Defining Range Indicator employs a sophisticated algorithm to analyze price action within the selected quarterly cycle. By examining the price behavior and patterns within this timeframe, the script determines the most significant high, low, and equilibrium levels that are likely to influence future price movements.
The indicator takes into account various factors, such as price momentum, volatility, and volume, to identify the key levels that define the range. These levels are then visually represented on the chart, providing traders with a clear picture of the important price points to watch.
The Defining Range Indicator works in the following steps:
Quarterly Cycle Selection: Traders select the desired quarterly cycle timeframe (90-minute, daily, weekly, monthly, or yearly) to focus the analysis on.
High and Low Identification: The script analyzes the price action within the selected quarterly cycle to determine the most significant high and low points. These levels are considered the defining high and low of the range.
Equilibrium Calculation: The indicator calculates the equilibrium level, which represents the midpoint between the defining high and low. This level is considered a potential pivot point where price may find balance or reverse direction.
Visual Representation: The defining high, low, and equilibrium levels are plotted on the chart, providing traders with a clear visual representation of the key price levels to monitor.
Expected Usage:
The Defining Range Indicator is designed to help traders gain a better understanding of the important price levels within a selected quarterly cycle. By identifying the defining high, low, and equilibrium, traders can make more informed decisions and enhance their trading strategies.
Support and Resistance Identification: The defining high and low levels act as potential support and resistance areas. Traders can use these levels to plan their trades, set entry and exit points, and manage risk effectively.
Pivot Point Trading: The equilibrium level represents a potential pivot point where price may find balance or change direction. Traders can watch for price behavior around this level to identify potential trading opportunities.
Backtesting and Historical Analysis: The Defining Range Indicator enables traders to backtest their strategies and understand how price has reacted to the defining levels in the past. By analyzing historical price action, traders can gain valuable insights into the effectiveness of their trading approach and make necessary adjustments.
Confluence and Confirmation: Traders can use the Defining Range Indicator in conjunction with other technical analysis tools, such as the Quarterly High and Low Indicator or the Quarterly Cycles Indicator, to confirm trade setups and increase confidence in their trading decisions.
Risk Management: By understanding the location of the defining high, low, and equilibrium levels, traders can make more informed decisions about stop-loss placement and position sizing. Setting stop-losses beyond these key levels can help mitigate the risk of getting stopped out prematurely due to short-term price fluctuations.
Limitations and Disclaimer:
While the Defining Range Indicator is a valuable tool, it should not be used in isolation. Traders should combine the insights gained from this indicator with other forms of analysis, risk management, and sound trading psychology to develop a well-rounded and effective trading approach.
Please note that the indicator's accuracy may be impacted by extreme market volatility or unusual events, and the defining levels should not be relied upon in isolation. As with any trading tool, individual results may vary, and past performance does not guarantee future outcomes. Traders should always exercise caution, use appropriate risk management techniques, and continuously educate themselves to adapt to changing market conditions.
This indicator is provided for educational purposes only and should not be considered financial advice. Always conduct your own due diligence and consult with a financial professional before making any trading decisions.
Privacy of Code:
The underlying logic and specific calculations used in the Defining Range Indicator's algorithm are proprietary and not disclosed to protect the intellectual property of the script. The methods used to identify the defining high, low, and equilibrium levels are the result of extensive research, testing, and refinement. By keeping these details confidential, the script maintains its competitive edge and ensures the protection of its intellectual property.
To be Used in Pair with Quarterly Cycle Indicator

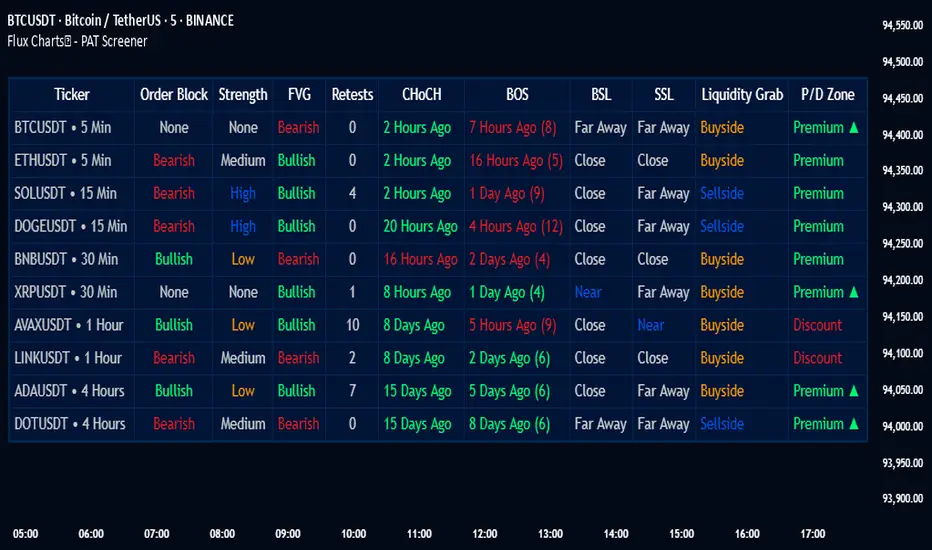
PAT Screener | Flux Charts💎 GENERAL OVERVIEW
Introducing our new Price Action Toolkit (PAT) Screener! This screener can spot trading opportunities that Price Action Toolkit offers across 8 different tickers! We believe that this screener will help you take a glimpse of the current state of the market much easier.
Features of the new Price Action Toolkit (PAT) Screener :
Finds Latest Across 8 Tickers:
Order Blocks
Breaker Blocks
Fair Value Gaps (FVG)
Inversion FVGs
Market Structures (BOS, CHoCH, CHoCH+)
Liquidity Zones
Liquidity Grabs
Premium / Discount Zones
Shows Additional Information Like :
Strength
Retests
(Bullish & Bearish) Volume
Consumption
Also :
All Features Support Tuning
Customizable Theme
📌 HOW DOES IT WORK ?
1. Order Blocks
Order blocks occur when there is a high amount of market orders exist on a price range. It is possible to find order blocks using specific formations on the chart.
The high & low volume of order blocks should be taken into consideration while determining their strengths. The determination of the high & low volume of order blocks are similar to FVGs, in a bullish order block, the high volume is the last 2 bars' total volume, while the low volume is the oldest bar's volume. In a bearish order block scenario, the low volume becomes the last 2 bars' total volume.
2. Breaker Blocks
Breaker blocks form when an order block fails, or "breaks". It is often associated with market going in the opposite direction of the broken order block, and they can be spotted by following order blocks and finding the point they get broken, i.e. price goes below a bullish order block.
The volume of a breaker block is simply the total volume of the bar that the original order block is broken. Often the higher the breaking bar's volume, the stronger the breaker block is.
The strength of Order & Breaker Blocks are calculated by the size of the block to the Average True Range (ATR) of the chart.
3. Fair Value Gaps
Fair value gaps often occur when there is an imbalance in the market, and can be spotted with a specific formation on the chart.
The volume when the FVG occurs plays an important role when determining the strength of it, so we've placed two bars on the FVG zone, indicating the high & low volumes of the FVG. The high volume is the total volume of the last two bars on a bullish FVG, while the low volume is - of the FVG. For a bearish FVG, the total volume of the last two bars is the low volume. The indicator can also detect FVGs that exist in other timeframes than the current chart.
4. Inversion Fair Value Gaps
A Fair Value Gap generally occur when there is an imbalance in the market. They can be detected by specific formations within the chart. An Inverse Fair Value Gap is when a FVG becomes invalidated, thus reversing the direction of the FVG.
IFVGs get consumed when a Close / Wick enters the IFVG zone. Check this example:
5. Market Structures
Sometimes specific market structures form and break as the market fills buy & sell orders. Formed Change of Character (CHoCH) and Break of Structure (BOS) often mean that market will change direction, and they can be spotted by inspecting low & high pivot points of the chart.
The number of times the chart recently had a BOS is displayed between brackets, Ex : (3)
6. Liquidity Zones
Buyside & Sellside Liquidity zones are where most traders place their take-profits and stop-losses in their long / short positions. They are spotted by using high & low pivot points on the chart.
7. Liquidity Grabs
Liquidity grabs occur when one of the latest pivots has a false breakout. Then, if the wick to body ratio of the bar is higher than 0.5 (can be changed from the settings) a liquidity grab has occurred.
8. Premium & Discount Zones
The premium zone is a zone that is over the fair value of the asset's price, and the discount zone is the opposite. They are formed by the latest high & low pivot points.
If the latest close price is outside the Premium or Discount zone, you will see "Premium ⬆️" or "Discount ⬇️". These mean that the price is currently higher than the premium zone or lower than the discount zone.
🚩UNIQUENESS
This screener offers a comprehensive dashboard for traders, combining multiple analytical elements with customizable settings to aid in decision-making across different tickers and timeframes. We believe that this will help traders spot trading opportunities much easier by providing crucial information in a single dashboard. Our new screener contains of common elements like Order & Breaker Blocks, Fair Value Gaps & IFVGs as well as rather unique elements like Liquidity Grabs . With the use of up to 8 tickers & timeframes , you can easily take a look at the bigger picture of the market. We recommend reading the "How Does It Work" section of the description to get a better understanding about how this indicator is unique to others.
⚙️SETTINGS
1. Tickers
You can set up to 8 tickers for the screener to scan here. You can also enable / disable them and set their individual timeframes.
You can enable / disable Retests, Strength, Consumption and (Bullish & Bearish) Volume for :
Order Blocks (Retests, Strength, Bullish & Bearish Volume)
Breaker Blocks (Retests, Strength, Volume)
Fair Value Gaps (Retests, Consumption, Strength, Bullish & Bearish Volume)
Inversion Fair Value Gaps (Retests, Consumption, Strength, Volume)
2. Order Blocks
Enabled -> Enables / Disables Order Blocks
Zone Invalidation -> Select between Wick & Close price for Order Block Invalidation.
Swing Length -> Swing length is used when finding order block formations. Smaller values will result in finding smaller order blocks.
3. Breaker Blocks
Enabled -> Enables / Disables Breaker Blocks
Zone Invalidation -> Select between Wick & Close price for Breaker Block Invalidation.
4. Fair Value Gaps
Enabled -> Enables / Disables Fair Value Gaps
Zone Invalidation -> Select between Wick & Close price for FVG Zone Invalidation.
Zone Filtering -> With "Average Range" selected, algorithm will find FVG zones in comparison with average range of last bars in the chart. With the "Volume Threshold" option, you may select a Volume Threshold % to spot FVGs with a larger total volume than average.
FVG Detection -> With the "Same Type" option, all 3 bars that formed the FVG should be the same type. (Bullish / Bearish). If the "All" option is selected, bar types may vary between Bullish / Bearish.
Detection Sensitivity -> You may select between Low, Normal or High FVG detection sensitivity. This will essentially determine the size of the spotted FVGs, with lower sensitivities resulting in spotting bigger FVGs, and higher sensitivities resulting in spotting all sizes of FVGs.
5. Inversion Fair Value Gaps
Zone Invalidation -> Select between Wick & Close price for IFVG Zone Invalidation. This setting also switches the type for IFVG consumption.
6. Market Structures
Break Of Structure (BOS) -> If the current structure of the market is broken in a bullish or bearish direction, it will be displayed.
Change Of Character (CHoCH) -> If the market shifts into another direction, it will be displayed.
Change Of Character+ (CHoCH+) -> This will display Change Of Characters detected with higher sensitivity if enabled.
7. Liquidity Zones
Buyside Liquidity -> Enables / Disables Buyside Liquidity
Sellside Liquidity -> Enables / Disables Sellside Liquidity
8. Liquidity Grabs
Pivot Length -> This setting determines the range of the pivots. This means a candle has to have the highest / lowest wick of the previous X bars and the next X bars to become a high / low pivot.
Wick-Body Ratio -> After a pivot has a false breakout, the wick-body ratio of the latest candle is tested. The resulting ratio must be higher than this setting for it to be considered as a liquidity grab.
9. Premium & Discount Zones
Enabled -> Enables / Disables Premium & Discount Zones.
10. Style
You can customize the visual looks of the screener here.
[AlbaTherium] MTF External Ranges Analysis - ERA-Orion for SMC MTF External Ranges Analysis - ERA - Orion for Smart Money Concepts
Introduction:
The MTF External Ranges Analysis - ERA - Orion offers enhanced insights into multi-timeframe external structure points, swing structure points, POIs (Points of Interest), and order blocks (OB) . By incorporating this enhancement, your multi-timeframe analysis are streamlined, simplifying the process and reducing chart workload, no need for manual chart drawing anymore, stay focus on Low Time Frame and get High Time Frame insights in one single Time frame.
This identification process remains effective even when focusing on Lower Time Frames (LTF), providing detailed insights without sacrificing the broader market perspective.
The MTF External Ranges Analysis - ERA – Orion is specifically designed to be used in conjunction with OptiStruct™ Premium for Smart Money Concepts . This strategic combination enhances the workflow of identifying optimal entry points. OptiStruct acts as the analysis tool for Lower Time Frames (LTF), zeroing in on immediate interest areas, while Orion expands this analysis to Higher Time Frames (HTF), providing a broader view of market trends and importants key levels . The integration of Orion with OptiStruct seamlessly merges LTF and HTF analyses, ensuring a thorough understanding of market dynamics for informed and strategic decision-making. This toolkit in one package assembly is pivotal for traders relying on Smart Money Concepts, offering unmatched clarity and actionable insights to navigate the markets effectively.
This tool offers an advanced smart money technical analysis to improve your trading experience. It introduces four key concepts:
Main Features:
Entries Enhancements
Inducements HTF
High/Low Markings HTF
Multiple Timeframes and Confluences on Extreme, Dec and SMT Order Blocks
By integrating these concepts into one, traders can identify high-probability zones across multiple timeframes and develop a thorough understanding of market dynamics. These confluence zones enhance order block skills and potential, establishing them as essential pillars in smart money trading strategies and enabling traders to make more informed decisions.
Settings Overview:
HTF Settings Enable HTF Analysis
Select timeframe {Select or 4H Chart}
Labels Alignment for Lines and Boxes
Inside bar ranges HTF
Break of Structure /Change of Character HTF
Inducements HTF
High/Low Markings HTF
High/Low Sweeps HTF
Extreme Order Blocks HTF
Decisional Order Blocks HTF
Smart Money Traps HTF
IDM Demands and Supplies HTF
Historical Order Blocks HTF
OB Mitigation HTF {touch/ extended}
Understanding the Features:
Chapter 1: Entries Enhancements
In this chapter, we delve into strategies to refine trading entries, focusing on the multi-timeframe analysis of extreme or decisional order blocks in the High Time Frame timeframe as a key point of interest. We highlight the significance of transitioning to the Low Time Frame chart for observing pivotal shifts in market behavior. By examining these concepts, traders can gain deeper insights into market dynamics and make more informed entries decisions at critical junctures.
Practical Example:
We had an Order Block Extreme on the 1-hour timeframe, and currently, we are on the recommended chart for trade entry, which is the 5-minute timeframe. We are patiently waiting to observe a 5-minute ChoCh in the market to enter a buying position since it's an OB Extreme Demand on the 1-hour timeframe. Here, it's crucial and important to focus on the entry timeframe rather than checking what's happening in the higher timeframe. The indicator facilitates this task as it provides us with real-time perspective and visibility of everything happening in the higher timeframe.
Chapter 2: Inducements HTF
It is important and useful to be aware of the various liquidity points across the different timeframes we use; sometimes, a reliable entry point in the Lower Time Frame (LTF) may be surrounded by inducements. Consequently, this point becomes unreliable, and prior to the arrival of this functionality, such anomalies could not be detected, especially when focusing on the market in the LTF. From now on, there will be no more such issues.
Practical Example:
Suppose we identify an Order Block Extreme on the 5M timeframe, indicating a potential entry level. However, when we switch to the 5M timeframe to look for an entry point, we observe an accumulation of inducements around this Order Block coming from a higher timeframe, whether it's M15 or H1. This suggests a potential weakness in the entry point and significant market liquidity, which will act as a trap zone. Before the introduction of this feature, we might have missed this crucial observation, but now we can detect these anomalies and adjust our strategy accordingly.
The only practical way to see theses confluences is to use this Indicator, see the example below
Chapter 03: High/Low – Bos - ChoCh Markings HTF
The High/Low Markings HTF feature in the MTF External Ranges Analysis - ERA - Orion provides a comprehensive view into the market's heartbeat across different timeframes, right from within the convenience of the Lower Time Frame (LTF). It meticulously highlights pivotal shifts, allowing traders to seamlessly discern market sentiment and anticipate potential price reversals without needing to toggle between multiple charts. This innovation ensures that critical market movements and sentiment across various timeframes are visible and actionable from a single, focused LTF perspective, enhancing decision-making and strategic planning in trading activities.
Understanding High/Low Markings in HTF Analysis
High/Low Markings in High Time Frame (HTF) analysis mark the market's extremities within a given period, pinpointing potential areas for reversals or continuation and delineating crucial support and resistance levels. These markings are not arbitrary but represent significant market responses, serving as essential indicators for traders and analysts to gauge market momentum and sentiment.
The Role of HTF in Market Analysis
HTF analysis extends a comprehensive view over market movements, distinguishing between ephemeral fluctuations and substantial trend shifts. By scrutinizing these high and low points across wider time frames, analysts can unravel the underlying market momentum, enabling more strategic, informed trading decisions.
Identifying High/Low Markings
Identifying these crucial points entails detailed chart analysis over extended durations—daily, weekly, or monthly. The search focuses on the utmost highs and lows within these periods, which are more than mere points on a chart. They are significant market levels that have historically elicited robust market reactions, serving as key indicators for future market behavior.
Real-world Example:
Chapter 04: Multiple Timeframes and Confluences on Extreme, Dec and SMT Order Blocks Across HTF
The Orion indicator serves as a bridge between the multiple dimensions of the market, enabling a unified and strategic interpretation of potential movements. It's an indispensable tool for those seeking to capitalize on major opportunity zones, where the convergence of diverse perspectives creates ideal conditions for significant market movements.
Designed to navigate through the data of different timeframes and market analysis, Orion provides a clear and consolidated view of major points of interest. With this indicator, traders can not only spot opportunity zones where consensus is strongest but also adjust their strategies based on the dynamic interaction of various market participants, all while remaining within the Lower Time Frame (LTF).
Conclusion:
MTF External Ranges Analysis - ERA - Orion for Smart Money Concepts as “ The Orion ” indicator captures consensus among scalpers, day traders , swing traders, and investors, turning key areas into major opportunities. It allows for precise identification of areas of interest by analyzing the convergence of actions from various market participants. In short, Orion is crucial for detecting and leveraging the most promising points of convergence in the market.
This identification occurs even while focusing on Lower Time Frames (LTF), allowing for detailed insights without losing the broader market perspective.
This document provides an extensive overview of MTF External Ranges Analysis - ERA - Orion , emphasizing its importance in comprehending market dynamics and utilizing essential smart money concepts trading principles.

Fake BreakoutThis indicator detect fake breakout on previous day high/low and option previous swing high and low
Rule Detect Fake Breakout On Previous Day High/Low Or Swing high low Fake Breakout -
1) Detect previous day high/low or swing high/low
2)
A) If price revisit on previous day high/swing high look for upside breakout after input
number of candle (1-5) price came back to previous high and breakout happen downside
it show sell because its fake breakout of previous day high or swing high
B) If price revisit on previous day low/swing low look for downside breakout after input
number of candle (1-5) price came back to previous low and breakout upside of previous
day low it show Buy because its fake breakout of previous day low or swing low
Disclaimer -Traders can use this script as a starting point for further customization or as a reference for developing their own trading strategies. It's important to note that past performance is not indicative of future results, and thorough testing and validation are recommended before deploying any trading strategy.

Swing IdentifierThe "Swing Identifier" is a custom Pine Script indicator designed for use in the TradingView platform. It serves to visually identify and mark swing highs and swing lows on a trading chart, which are key concepts in technical analysis. This script is comprehensive and customizable, making it a useful tool for traders looking to pinpoint potential trend reversals and support or resistance areas.
**Key Features of the 'Swing Identifier' Indicator:**
1. **Swing Range Input:**
- This input determines the number of bars to the left and right of the current bar that the script will examine to identify a swing high or low. A larger value will look for swings over a broader range, potentially identifying more significant swings but at the expense of sensitivity.
2. **Swing Strength Input:**
- The swing strength is set as a percentage and is used to filter out insignificant price movements. A swing high or low is only considered valid if the percentage change from the last swing is greater than this input value. This feature helps in avoiding false signals in sideways or less volatile markets.
3. **Use Wicks Option:**
- Users can choose whether to consider the wicks of the candles or just the closing prices in identifying swings. This feature adds flexibility, allowing the script to be tailored to different trading styles and strategies.
4. **Line Color Customization:**
- The color of the lines marking the swings can be customized, enhancing the visual appeal and readability of the chart.
**Operational Mechanics:**
1. **Identification of Swing Highs and Lows:**
- The script uses the `ta.pivothigh` and `ta.pivotlow` functions to identify swing highs and lows. Whether it uses the high/low of the candles or their closing prices is determined by the user's choice in the "Use Wicks" option.
2. **Drawing and Updating Lines:**
- When a new swing high or low is identified, and it meets the percentage change criteria from the previous swing, a line is drawn from the last swing low to the current high (or vice versa). If a new swing high (or low) is identified that is higher (or lower) than the previous one, the old line is deleted, and a new line is drawn.
3. **Swing Update Logic:**
- The script maintains a toggle mechanism to look alternatively for highs and lows. This ensures that it sequentially identifies a high and then a low (or vice versa), which aligns with how actual market swings behave.
**Usage in Trading:**
1. **Identifying Trend Reversals:**
- By marking swing highs and lows, the script helps traders identify potential trend reversals. A break of a swing low in an uptrend or a swing high in a downtrend could signal a change in the prevailing trend.
2. **Support and Resistance:**
- Swing highs and lows often act as levels of support and resistance. Traders can use these levels for setting entry or exit points, stop losses, and take profit orders.
3. **Customization for Strategy:**
- The customizable nature of the script allows traders to adjust the parameters according to their trading strategy, time frame, and asset volatility.
In summary, the "Swing Identifier" is a versatile and customizable tool that aids in visually identifying crucial price swing points, thereby assisting traders in making informed decisions based on technical analysis principles.

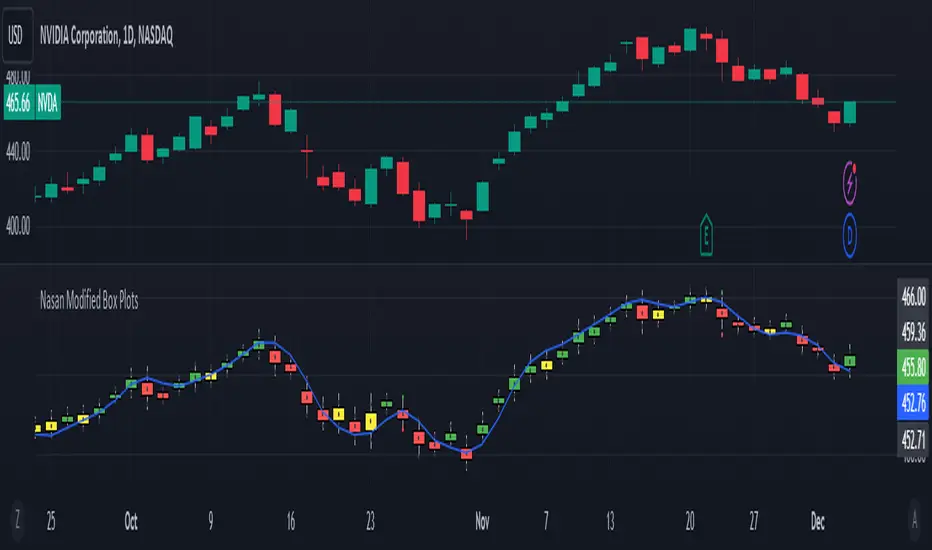
Modified Box Plots
Box Plot Concept: The script creates a modified box plot where the central box represents the range within 1 standard deviation from the midpoint (hl2), which is the average of the high and low prices. The whiskers extend to cover a range of 3 standard deviations, providing a visualization of the overall price distribution.
Color Scheme: The color of the modified box plot is determined based on comparisons between the current midpoint (g) and the +/- 1 SD values of the previous candle (i and j ). If g > i , the color is green; if g < j , it's red; otherwise, it's yellow. This color scheme allows users to quickly assess the relationship between the current market conditions and recent price movements. if the mid point price is above/below +/- 1 SD values of the previous candle the price movement is considered as significant.
Plotcandle Function: The plotcandle function is employed to visualize the modified box plot. The color of the box is dynamically determined by the candleColor variable, which reflects the current market state based on the color scheme. The wicks, represented by lines extending from the box, are colored in white.
Explanation of Box and Wicks:
Box (Open and Close): In this modified box plot, the box does not represent traditional open and close prices. Instead, it signifies a range within 1 standard deviation of the midpoint (hl2), providing insight into the typical price variation around the average of the high and low.
Wicks (High and Low): The wicks extend from the box to cover a range of 3 standard deviations from the midpoint (hl2). They do not correspond to the actual high and low prices but serve as a visualization of potential outliers in the price distribution. The actual high and low prices are also plotted as green and red dots when the actual high and low prices fall outside the +/- 3SD wicks (whiskers) and also indicate the prices does not fit the distribution based on the recent price volatility.
In summary, this modified box plot offers a unique perspective on price distribution by considering standard deviations from the midpoint. The color scheme aids in quickly assessing market conditions, and the wicks provide insights into the potential presence of outliers. It's essential to understand that the box and wicks do not represent traditional open, close, high, and low prices but offer a different way to visualize and interpret intraday price movements.
Step by step explanation
Here's the step-by-step explanation:
a = ta.highest(high, 7): Calculates the highest high in the last 7 bars.
b = ta.lowest(low, 7): Calculates the lowest low in the last 7 bars.
c = ta.stdev(hl2, 7): Calculates the standard deviation of the average of high and low prices (hl2) over the last 7 bars.
d = (a - b) / c: Computes a scaling factor d based on the highest, lowest, and standard deviation. This factor is used to scale the intraday range in the next steps.
e = (high - low): Calculates the intraday range of the candle.
f = e / d: Estimates the standard deviation (f) of the intraday candle price using the scaling factor d.
g = hl2: Defines the intraday midpoint of the candle, which is the average of high and low prices.
i = g + 1 * f, j = g - 1 * f, k = g + 3 * f, l = g - 3 * f: Calculate values representing coverage of +1 SD, -1 SD, +3 SD, and -3 SD from the intraday midpoint.
The script utilizes historical high, low, and standard deviation values to dynamically estimate the standard deviation of the intraday candle, providing a measure of volatility for the current price range. This estimation is then used to construct a modified box plot around the intraday midpoint.
In addition I have included a 7 period hull moving average just to see the overall trend direction.
Conclusion:
The "Nasan Modified Box Plots" indicator on TradingView is a dynamic visualization tool that provides insights into the distribution of price ranges over a specified period. It adapts to changing market conditions by incorporating historical data in the calculation of a scaling factor (d). The indicator constructs a modified box plot, where the size of the box and the whiskers is determined by recent volatility
YinYang TrendTrend Analysis has always been an important aspect of Trading. There are so many important types of Trend Analysis and many times it may be difficult to identify what to use; let alone if an Indicator can/should be used in conjunction with another. For these exact reasons, we decided to make YinYang Trend. It is a Trend Analysis Toolkit which features many New and many Well Known Trend Analysis Indicators. However, everything in there is added specifically for the reason that it may work well in conjunction with the other Indicators prevalent within. You may be wondering, why bother including common Trend Analysis, why not make everything unique? Ideally, we would, however, you need to remember Trend Analysis may be one of the most common forms of charting. Therefore, many other traders may be using similar Trend Analysis either through plotting manually or within other Indicators. This all boils down to Psychology; you are trading against other traders, who may be seeing some of the similar information you are, and therefore, you may likewise want to see this information. What affects their trading decisions may affect yours as well.
Now enough about Trend Analysis, what is within this Indicator, and what does it do? Well, first let’s quickly mention all of its components, then we will, through a Tutorial, discuss each individually and finally how each comes together as a cohesive whole. This Indicator features many aspects:
Bull and Bear Signals
Take Profit Signals
Bull and Bear Zones
Information Tables displaying: (Boom Meter, Bull/Bear Strength, Yin/Yang State)
16 Cipher Signals
Extremes
Pivots
Trend Lines
Custom Bollinger Bands
Boom Meter Bar Colors
True Value Zones
Bar Strength Indexes
Volume Profile
There are many things to cover within our Tutorial so let's get started, chronologically from the list above.
Tutorial:
Bull and Bear Signals:
We’ve zoomed out quite a bit for this example to help give you a broader aspect of how these Bull and Bear signals work. When a signal appears, it is displaying that there may be a large amount of Bullish or Bearish Trend Analysis occurring. These signals will remain in their state of Bull or Bear until there is enough momentum change that they change over. There are a couple Options within the Settings that dictate when/where/why these signals appear, and this example is using their default Settings of ‘Medium’. They are, Purchase Speed and Purchase Strength. Purchase Speed refers to how much Price Movement is needed for a signal to occur and Purchase Strength refers to how many verifications are required for a signal to occur. For instance:
'High' uses 15 verifications to ensure signal strength.
'Medium' uses 10 verifications to ensure signal strength.
'Low' uses 5 verifications to ensure signal strength.
'Very Low' uses 3 verifications to ensure signal strength.
By default it is set to Medium (10 verifications). This means each verification is worth 10%. The verifications used are also relevant to the Purchase Speed; meaning they will be verified faster or slower depending on its speed setting. You may find that Faster Speeds and Lower Verifications may work better on Higher Time Frames; and Slower Speeds and Higher Verifications may work better on Lower Time Frames.
We will demonstrate a few examples as to how the Speed and Strength Settings work, and why it may be beneficial to adjust based on the Time Frame you’re on:
In this example above, we’ve kept the same Time Frame (1 Day), and scope; but we’ve changed Purchase Speed from Medium->Fast and Purchase Strength from Medium-Very Low. As you can see, it now generates quite a few more signals. The Speed and Strength settings that you use will likely be based on your trading style / strategy. Are you someone who likes to stay in trades longer or do you like to swing trade daily? Likewise, how do you go about identifying your Entry / Exit locations; do you start on the 1 Day for confirmation, then move to the 15/5 minute for your entry / exit? How you trade may determine which Speed and Strength settings work right for you. Let's jump to a lower Time Frame now so you can see how it works on the 15/5 minute.
Above is what BTC/USDT looks like on the 15 Minute Time Frame with Purchase Speed and Strength set to Medium. You may note that the signals require a certain amount of movement before they get started. This is normal with Medium and the amount of movement is generally dictated by the Time Frame. You may choose to use Medium on a Lower Time Frame as it may work well, but it may also be best to change it to a little slower.
We are still on the 15 Minute Time Frame here, however we simply changed Purchase Speed from Medium->Slow. As you can see, lots of the signals have been removed. Now signals may ‘hold their ground’ for much longer. It is important to adjust your Purchase Speed and Strength Settings to your Time Frame and personalized trading style accordingly.
Above we have now jumped down to the 5 Minute Time Frame. Our Purchase Speed is Slow and our Purchase Strength is Medium. We can see it looks pretty good, although there is some signal clustering going on in the middle there. If we change our Settings, we may be able to get rid of that.
We have changed our Purchase Speed from Slow->Snail (Slowest it can go) and Purchase Strength from Medium->Very Low (Lowest it can go). Changing it from Slow-Snail helped get rid of the signal clustering. You may be wondering why we lowered the Strength from Medium->Very Low, rather than going from Medium->High. This is a use case scenario and one you’ll need to decide for yourself, but we noticed when we changed the Speed from Slow->Snail that the signal clustering was gone, so then we checked both High and Very Low for Strengths to see which produced the best looking signal locations.
Please remember, you don’t have to use it the exact way we’ve displayed in this Tutorial. It is meant to be used to suit your Trading Style and Strategy. This is why we allow you to modify these settings, rather than just automating the change based on Time Frames. You’ll likely need to play around with it, as you’ll notice different settings may work better on certain pairs and Time Frames than others.
Take Profit Signals:
We’ve reset our Purchase Settings, everything is on defaults right now at Medium. We’ve enabled Take Profit signals. As you can see there are both Take Profit signals for the Bulls and the Bears. These signals are not meant to be used within automation. In fact, none of this indicator is. These signals are meant to show there has been a strong change in momentum, to such an extent that the signal may switch from its current (Bull or Bear) and now may be a good time to Take Profit. Your Take Profit Settings likewise has a Speed and Strength, and you can set them differently than your Purchase Settings. This is in case you want to Take Profit in a different manner than your Purchase Signals. For instance:
In the example above we’ve kept Purchase Strength and Speed at Medium but we changed our Take Profit Speed from Medium->Snail and our Take Profit Strength from medium->Very Low. This greatly reduces the amount of Take Profit signals, and in some cases, none are even produced. This form of Take Profit may act more as a Trailing Take Profit that if it’s not hit, nothing appears.
In this example we have changed our Purchase Speed from Medium->Fast, our Purchase Strength from Medium->Very Low. We’ve also changed our Take Profit Speed from Snail->Medium and kept our Take Profit Strength on Very Low. Now we may get our signals quicker and likewise our Take Profit may be more rare. There are many different ways you can set up your Purchase and Take Profit Settings to fit your Trading Style / Strategy.
Bull and Bear Zones:
We have disabled our Take Profit locations so that you can see the Bull and Bear Zones. These zones change color when the Signals switch. They may represent some strong Support and Resistance locations, but more importantly may be useful for visualizing changes in momentum and consolidation. These zones allow you to see various Moving Averages; and when they start to ‘fold’ (cross) each other you may see changes in momentum. Whereas, when they’re fully stretched out and moving all in the same direction, it can provide insight that the current rally may be strong. There is also the case where they look like they’re ‘twisted’ together. This happens when all of the Moving Averages are very close together and may be a sign of Consolidation. We will go over a few examples of each of these scenarios so you can understand what we’re referring to.
In this example above, there are a few different things happening. First we have the yellow circle, where the final and slowest Moving Average (MA) crossed over and now all of the MA’s that form the zone are Bullish. You can see this in the white circle where there are no MA’s that are crossing each other. Lastly, within the blue circle, we can see how some of the faster MA’s are crossing under each other. This is a bullish momentum change. The Faster moving MA’s will always be the first ones to cross before the Slower ones do. There is a color scheme in place here to represent the Speed of the MA within the Zone. Light blue is the fastest moving Bull color -> Light Green and finally -> Dark Green. Yellow is the fastest moving Bear color -> Orange and finally -> Red / Dark Red within the Zone.
Next we will review a couple different examples of what Consolidation looks like and why it is very important to look out for. Consolidation is when Most, if not All of the MA’s are very tightly ‘twisted’ together. There is very little spacing between almost all of the MA’s in the example above; highlighted by the white circle. Consolidation is important as it may indicate a strong price movement in either direction will occur soon. When the price is consolidating it means it has had very little upwards or downwards movement recently. When this happens for long enough, MA’s may all get very similar in value. This may cause high volatility as the price tries to break out of Consolidation. Let's look at another example.
Above we have two more examples of what Consolidation looks like and how high Volatility may occur after the Consolidation is broken. Please note, not all Consolidation will create high Volatility but it is something you may want to look out for.
Information Tables displaying: (Boom Meter, Bull/Bear Strength, Yin/Yang State):
Information tables are a very important way of displaying information. It contains 3 crucial pieces of information:
Boom Meter
Bull/Bear Strength
Yin/Yang State
Boom Meter is a meter that goes from 0-100% and displays whether the current price is Dumping (0 - 29%), Consolidating (30 - 70%) or Pumping (71 - 100%). The Boom Meter is meant to be a Gauge to how the price is currently fairing. It is composed of ~50 different calculations that all vary different weights to calculate its %. Many of the calculations it uses are likewise used in other things, such as the Bull/Bear Strength, Bull/Bear Zone MA cross’, Yin/Yang State, Market Cipher Signals, RSI, Volume and a few others. The Boom Meter, although not meant to be used solely to make purchase decisions, may give you a good idea of current market conditions considering how many different things it evaluates.
Bull/Bear Strength is relevant to your Purchase Speed and Strength. It displays which state it is currently in, and the % it is within that state. When a % hits 0, is when the state changes. When states change, they always start at 100% initially and will go down at the rate of Purchase Strength (how many verifications are needed). For instance, if your Purchase Strength is set to ‘Medium’ it will move 10% per verification +/-, if it is set to High, it will move 6.67% per verification +/-. Bull/Bear Strength is a good indicator of how well that current state is fairing. For instance if you started a Long when the state changed to Bull and now it is currently at Bull with 20% left, that may be a good indication it is time to get out (obviously refer to other data as well, but it may be a good way to know that the state is 20% away from transitioning to Bear).
Yin/Yang State is the strongest MA cross within our Indicator. It is unique in the sense that it is slow to change, but not so much that it moves slowly. It isn’t as simple as say a Golden/Death Cross (50/200), but it crosses more often and may hold similar weight as it. Yin stands for Negative (Bearish) and Yang stands for Positive (Bullish). The price will always be in either a state of Yin or Yang, and just because it is in one, doesn’t mean the price can’t/won’t move in the opposite direction; it simply means the price may be favoring the state it is in.
16 Cipher Signals:
Cipher Signals are key visuals of MA cross’ that may represent price movement and momentum. It would be too confusing and hard to decipher these MA’s as lines on a chart, and therefore we decided to use signals in the form of symbols instead. There are 12 Standard and 4 Predictive/Confirming Cipher signals. The Standard Cipher signals are composed of 6 Bullish and 6 Bearish (they all have opposites that balance each other out). There can never be 2 of the same signal in a row, as the Bull and Bear cancel each other out and it's always in a state of one or the other. When all 6 Bullish or Bearish signals appear in a row, very closely together, without any of the opposing signals it may represent a strong momentum movement is about to occur.
If you refer to the example above, you’ll see that the 6 Bullish Cipher signals appeared exactly as mentioned above. Shortly after the Green Circle appeared, there was a large spike in price movement in favor of the Bulls. Cipher signals don’t need to appear in a cluster exactly like the white circle in this photo for momentum to occur, but when it does, it may represent volatility more than if it is broken up with opposing signals or spaced out over a longer time span.
Above is an example of the opposite, where all 6 Bearish Cipher signals appeared together without being broken by a Bullish Cipher signal or being too far spaced out. As you can see, even though past it there was a few Bullish signals, they were quickly reversed back to Bearish before a large price movement occurred in favor of the Bears.
In the example above we’ve changed Cipher signals to Predictive and Confirming. Support Crosses (Green +) and Blood Diamonds (Red ♦) are the normal Cipher Signals that appear within the Standard Set. They are the first Cipher Signal that appears and are the most common ones as well. However, just because they are the first, that doesn’t mean they aren’t a powerful Cipher signal. For this reason, there are Predictive and Confirming Cipher signals for these. The Predictive do just that, they appear slightly sooner (if not the same bar) as the regular and the Confirming appear later (1+ bars usually). There will be times that the Predictive appears, but it doesn’t resort to the Regular appearing, or the Regular appears and the Confirming doesn’t. This is normal behavior and also the purpose of them. They are meant to be an indication of IF they may appear soon and IF the regular was indeed a valid signal.
Extremes:
Extremes are MA’s that have a very large length. They are useful for seeing Cross’ and Support and Resistance over a long period of time. However, because they are so long and slow moving, they might not always be relevant. It’s usually advised to turn them on, see if any are close to the current price point, and if they aren’t to turn them off. The main reason being is they stretch out the chart too much if they’re too far away and they also may not be relevant at that point.
When they are close to the price however, they may act as strong Support and Resistance locations as circled in the example above.
Pivots:
Pivots are used to help identify key Support and Resistance locations. They adjust on their own in an attempt to keep their locations as relevant as possible and likewise will adjust when the price pushes their current bounds. They may be useful for seeing when the Price is currently testing their level as this may represent Overbought or Oversold. Keep in mind, just because the price is testing their levels doesn’t mean it will correct; sometimes with high volatility or geopolitical news, movement may continue even if it is exhibiting Overbought or Oversold traits. Pivots may also be useful for seeing how far the price may correct to, giving you a benchmark for potential Take Profit and Stop Loss locations.
Trend Lines:
Trend Lines may be useful for identifying Support and Resistance locations on the Vertical. Trend Lines may form many different patterns, such as Pennants, Channels, Flags and Wedges. These formations may help predict and drive the price in specific directions. Many traders draw or use Indicators to help create Trend Lines to visualize where these formations will be and they may be very useful alone even for identifying possible Support and Resistance locations.
If you refer to the previous example, and now to this example, you’ll notice that the Trend Line that supported it in 2023 was actually created in June 2020 (yellow circle). Trend Lines may be crucial for identifying Support and Resistance locations on the Vertical that may withhold over time.
Custom Bollinger Bands:
Bollinger Bands are used to help see Movement vs Consolidation Zones (When it's wide vs narrow). It's also very useful for seeing where the correction areas may be. Price may bounce between top and bottom of the Bollinger Bands, unless in a pump or dump. The Boom Meter will show you whether it is currently: Dumping, Consolidation or Pumping. If combined with Boom Meter Bar Colors it may be a good indication if it will break the Bollinger Band (go outside of it). The Middle Line of the Bollinger Band (White Line) may be a very strong support / resistance location. If the price closes above or below it, it may be a good indication of the trend changing (it may indicate one of the first stages to a pump or dump). The color of the Bollinger Bands change based on if it is within a Bull or Bear Zone.
What makes this Bollinger Band special is not only that it uses a custom multiplier, but it also incorporates volume to help add weight to the calculation.
Boom Meter Bar Colors:
Boom Meter Bar Colors are a way to see potential Overbought and Oversold locations on a per bar basis. There are 6 different colors within the Boom Meter bar colors. You have:
Overbought and Very Bullish = Dark Green
Overbought and Slightly Bullish = Light Green
Overbought and Slight Bearish = Light Red
Oversold and Very Bearish = Dark Red
Oversold and Slightly Bearish = Orange
Oversold and Slightly Bullish = Light Purple
When there is no Boom Meter Bar Color prevalent there won’t be a color change within the bar at all.
Just because there is a Boom Meter Bar Color change doesn’t mean you should act on it purchase or sell wise, but it may be an indication as to how that bar is fairing in an Overbought / Oversold perspective. Boom Meter Bar Colors are mainly based on RSI but do take in other factors like price movement to determine if it is Overbought or Oversold. When it comes to Boom Meter Bar Color, you should take it as it is, in the sense that it may be useful for seeing how Individual bars are fairing, but also note that there may be things such as:
When there is Very Overbought (Dark Green) or Very Oversold (Dark Red), during massive pump or dumps, it will maintain this color. However, once it has lost ‘some’ momentum it will likely lose this color.
When there has been a massive Pump or Dump, and there is likewise a light purple or light red, this may mean there is a correction or consolidation incoming.
True Value Zones:
True Value zones are our custom way of displaying something that is similar to a Bollinger Band that can likewise twist like an MA cross. The main purpose of it is to display where the price may reside within. Much like a Bollinger Band it has its High and Low within its zone to specify this location. Since it has the ability to cross over and under, it has the ability to specify what it thinks may be a Bullish or Bearish zone. This zone uses its upper level to display what may be a Resistance location and its lower level to display what may be a Support location. These Support and Resistance locations are based on Momentum and will move with the price in an attempt to stay relevant.
You may use these True Values zones as a gauge of if the price is Overbought or Oversold. When the price faces high volatility and moves outside of the True Value Zones, it may face consolidation or likewise a correction to bring it back within these zones. These zones may act as a guideline towards where the price is currently valued at and may belong within.
Bar Strength Indexes:
Bar Strength Indexes are our way of ranking each bar in correlation to the last few. It is based on a few things but is highly influenced on Open/Close/High/Low, Volume and how the price has moved recently. They may attempt to ‘rate’ each bar and how Bullish/Bearish each of these bars are. The Green number under the bar is its Bullish % and the Red number above the bar is its Bearish %. These %’s will always equal 100% when combined together. Bar Strength Indexes may be useful for seeing when either Bullish or Bearish momentum is picking up or when there may be a reversal / consolidation.
These Bar Strength Indexes may allow you to decipher different states. If you refer to the example above, you may notice how based on how the numbers are changing, you may see when it has entered / exited Bullish, Bearish and Consolidation. Likewise, if you refer to the current bar (yellow circle), you can see that the Bullish % has dropped from 93 to 49; this may be signifying that the Bullish movement is losing momentum. You may use these changes in Bar Indexes as a guide to when to enter / end trades.
Volume Profile:
Volume Profile has been something that has been within TradingView for quite some time. It is a very useful way of seeing at what Horizontal Price there has been the most volume. This may be very useful for seeing not only Support and Resistance locations based on Volume, but also seeing where the majority of Limit Orders are placed. Limit Orders are where traders decide they want to either Buy / Sell but have the order placed so the trade won’t happen until the price reaches a certain amount. Either through many orders from many traders, or a single order from a ‘Whale’ (trader with a lot of capital); you may see Support and Resistance at specific Price Points that have large Volume.
Many Volume Profile Indicators feature a breakdown of all the different locations of volume, along with a Point Of Control (POC) line to designate where the most Volume has been. To try and reduce clutter within our already very saturated Toolkit Indicator, we’ve decided to strip our Volume Profile to only display this POC line. This may allow you to see where the crucial Volume Support and Resistance is without all of the clutter.
You may be wondering, well how important is this Volume Profile POC line and how do I go about using it? Aside from it being a gauge towards where Support and Resistance may be within Volume, it may also be useful for identifying good Long/Short locations. If you think of the line as a ‘Battle’ between the Bulls and Bears, they’re both fighting over that line. The Bears are wanting to break through it downwards, and the Bulls are wanting to break through it upwards. When one side has temporarily won this battle, this means they may have more Capital to push the price in their direction. For instance, if both the Bulls and the Bears are fighting over this POC price, that means the Bears think that price is a good spot to sell; however, the Bulls also deem that price to be a good point to buy. If the Bulls were to win this battle, that means the Bears either canceled their orders to reevaluate, or all of their orders have been completed from the Bulls buying them all. What may happen after that is, if the Bulls were able to purchase all of these Limit Sell Orders, then they may still have more Capital left to continue to pressure the price upwards. The same may be true for if the Bears were to win this ‘Battle’.
How to use YinYang Trend as a cohesive whole:
Hopefully you’ve read and understand how each aspect of this Indicator works on its own, as knowing how/what they each do is important to understanding how it is used as a cohesive whole. Due to the fact that this Toolkit of an Indicator displays so much data, you may find it easier to use and understand when you’re zoomed in a little, somewhat like we are in this example above.
If we refer to the example above, you may like us, deduce a few things:
1. The current price may be VERY Overbought. This may be seen by a few different things:
The Boom Meter Bar Colors have been exhibiting a Dark Green color for 6 bars in a row.
The price has continuously been moving the High (red) Pivot Upwards.
Our Boom Meter displays ‘Pumping’ at 100%.
The price broke through a Downward Trend Line that was created in February of 2022 at 45,000 like it was nothing.
The Bar Strength Index hit a Bullish value of 93%.
The Price broke out of the Bollinger Bands and continues to test its upper levels.
The Low is much greater than our fastest moving MA that creates the Purchase Zones.
The Price is vastly outside of the True Value Zone.
The Bar Strength Index of our current bar is 50% bullish, which is a massive decrease from the previous bar of 93%. This may indicate that a correction is coming soon.
2. Since we’ve identified the current price may be VERY Overbought, next we need to identify if/when/to where it may correct to:
We’ve created a new example here to display potential correction areas. There are a few places it has the ability to correct to / within:
The downward Trend Line (red) below the current bar sitting currently at 32,750. This downward Trend Line is at the same price point as the Fastest MA of our Purchase Zone which may provide some decent Support there.
Between two crucial Pivot heights, within a zone of 30,000 to 31,815. This zone has the second fastest MA from the Purchase Zone right near the middle of it at 31,200 which may act as a Support within the Zone. Likewise there is the Bollinger Band Basis which is also resting at 30,000 which may provide a strong Support location here.
If 30,000 fails there may be a correction all the way to the bottom of our True Value Zone and the top of one of our Extremes at 27,850.
If 27,850 fails it may correct all the way to the bottom of our Purchase Zone / lowest of our Extremes at 27,350.
If all of the above fails, it may test our Volume Profile POC of 26,430. If this POC fails, the trend may switch to Bearish and continue further down to lower levels of Support.
The price can always correct more than the prices mentioned above, but considering overall this Indicator is favoring the Bulls, we will tailor this analysis in Favor of the Bullish Momentum maintaining even during this correction. For these reasons, we think the price may correct between the 30,000 and 31,815 zone before continuing upwards and maintaining this Bullish Momentum.
Please note, these correction estimates are just that, they’re estimates. Aside from the fact that the price is very overbought right now and our Bar Strength Index may be declining (bar hasn’t closed yet); the Boom Meter Strength remains at 100%, meaning there may not be much Bearish momentum changes happening yet. We just want to show you how an Preemptive analysis may be done before there are even Bearish Cipher Signals appearing.
Using this Indicator, you may be able to decipher Entry and Exits. In the previous example, we went over how you may use it to see where a correction (Exit / Take Profit) may be and how far this correction may go. In this example above we will be discussing how to identify Entry locations. We will be discussing a Bullish Buy entry but the same rules apply for a Bearish Sell Entry just the opposite with the Cipher Signals.
If you refer to where we circled in white, this is where the Purchase Zones faced Consolidation. When the Purchase Zones all get tight and close together like that, this may represent Volatility and Momentum in either direction may occur soon.
This was then followed by all 6 of the Standard Cipher Signals closely in succession to each other. This means the Momentum may be favoring the Bulls. If this was likewise all 6 of the Bearish Cipher Signals closely in succession, than the momentum change would favor the Bears.
If you were looking for an entry, and you saw Consolidation with the Purchase Zones and then shortly after you saw the Green Circle and Blue Flag (they can swap order); this may now be a good Entry location.
We will conclude this Tutorial here. Hopefully this has taught you how this Trend Analysis Toolkit may help you locate multiple different types of important Support and Resistance locations; as well as possible Entry and Exit locations.
Settings:
1. Bull/Bear Zones:
1.1. Purchase Speed (Bull/Bear Signals and Take Profit Signals):
Speed determines how much price movement is needed for a signal to occur.
'Sonic' uses the extremities to try and get you the best entry and exit points, but is so quick, its speed may reduce accuracy.
'Fast' may attempt to capitalize on price movements to help you get SOME or attempt to lose LITTLE quickly.
'Medium' may attempt to get you the most optimal entry and exit locations, but may miss extremities.
'Slow' may stay in trades until it is clear that momentum has changed.
'Snail' may stay in trades even if momentum has changed. Snail may only change when the price has moved significantly (This may result in BIG gains, but potentially also BIG losses).
1.2. Purchase Strength (Bull/Bear Signals and Take Profit Signals):
Strength ensures a certain amount of verifications required for signals to happen. The more verifications the more accurate that signal is, but it may also change entry and exit points, and you may miss out on some of the extremities. It is highly advised to find the best combination between Speed and Strength for the TimeFrame and Pair you are trading in, as all pairs and TimeFrames move differently.
'High' uses 15 verifications to ensure signal strength.
'Medium' uses 10 verifications to ensure signal strength.
'Low' uses 5 verifications to ensure signal strength.
'Very Low' uses 3 verifications to ensure signal strength.
2. Cipher Signals:
Cipher Signals are very strong EMA and SMA crosses, which may drastically help visualize movement and help you to predict where the price will go. All Symbols have counter opposites that cancel each other out (YinYang). Here is a list, in order of general appearance and strength:
White Cross / Diamond (Predictive): The initial indicator showing trend movement.
Green Cross / Diamond (Regular): Confirms the Predictive and may add a fair bit of strength to trend movement.
Blue Cross / Diamond (Confirming): Confirms the Regular, showing the trend might have some decent momentum now.
Green / Red X: Gives momentum to the current trend direction, possibly confirming the Confirming Cross/Diamond.
Blue / Orange Triangle: may confirm the X, Possible pump / dump of decent size may be coming soon.
Green / Red Circle: EITHER confirms the Triangle and may mean big pump / dump is potentially coming, OR it just hit its peak and signifies a potential reversal correction. PAY ATTENTION!
Green / Red Flag: Oddball that helps confirm trend movements on the short term.
Blue / Yellow Flag: Oddball that helps confirm trend movements on the medium term (Yin / Yang is the long term Oddball).
3. Bull/Bear Signals:
Bear and Bull signals are where the momentum has changed enough based on your Purchase Speed and Strength. They generally represent strong price movement in the direction of the signal, and may be more reliable on higher TimeFrames. Please don’t use JUST these signals for analysis, they are only meant to be a fraction of the important data you are using to make your technical analysis.
4. Take Profit Signals:
Take Profit signals are guidelines that momentum has started to change back and now may be a good time to take profit. Your Take Profit signals are based on your Take Profit Speed and Strength and may be adjusted to fit your trading style.
5. Information Tables:
Information tables display very important data and help to declutter the screen as they are much less intrusive compared to labels. Our Information tables display: Boom Meter, Purchase Strength of Bull/Bear Zones and Yin/Yang State.
Boom Meter: Uses over 50 different calculations to determine if the pair is currently 'Dumping' (0-29%), 'Consolidating' (30-70%), or 'Pumping' (71-100%).
Bull / Bear Strength: Shows the strength of the current Bull / Bear signal from 0-100% (Signals start at 100% and change when they hit 0%). The % it moves up or down is based on your 'Purchase Strength'.
Yin / Yang state: Is one of the strongest EMA/SMA crosses (long term Oddball) within this Indicator and may be a great indication of which way the price is moving. Do keep in mind if the price is consolidating when changing state, it may have the highest chance of switching back also. Once momentum kicks in and there is price movement the state may be confirmed. Refer to other Cipher Symbols, Extremes, Trend, BOLL, Boom %, Bull / Bear % and Bar colors when Bull / Bear Zones are consolidating and Yin / Yang State changes as this is a very strong indecision zone.
6. Bull / Bear Zones:
Our Bull / Bear zones are composed of 8 very important EMA lengths that may act as not only Support and Resistance, but they help to potentially display consolidation and momentum change. You can tell when they are getting tight and close together it may represent consolidation and when they start to flip over on each other it may represent a change in momentum.
7. MA Extremes:
Our MA Extremes may be 3 of the most important long term moving averages. They don’t always play a role in trades as sometimes they’re way off from the price (cause they’re extreme lengths), but when they are around price or they cross under or over each other, it may represent large changes in price are about to occur. They may be very useful for seeing strong resistance / support locations based on price averages. Extremes may transition from a Support to a Resistance based on its position above or below them and how many times the price has either bounced up off them (Supporting) or Bounced back down after hitting them (Resistance).
8. Pivots:
Pivots may be a very important indicator of support and resistance for horizontal price movement. Pivots may represent the current strongest Support and Resistance. When the Pivot changes, it means a new strong Support or Resistance has been created. Sometimes you'll notice the price constantly pushes the pivot during a massive Pump or Dump. This is normal, and may indicate high levels of volatility. This generally also happens when the price is outside of the Bollinger Bands and is also Over or Undervalued. The price usually consolidates for a while after something like this happens before more drastic movement may occur.
9. Trend Lines:
Trend lines may be one of the best indicators of support and resistance for diagonal price movement. When a Trend Line fails to hold it may be a strong indication of a dump. Keep a close eye to where Upward and Downward Trend Lines meet. Trend lines can create different trading formations known as Pennants, Flags and Wedges. Please familiarize yourself with these formations So you know what to look for.
10. Bollinger Bands (BOLL):
Bollinger Bands may be very useful, and ours have been customized so they may be even more accurate by using a modified calculation that also incorporates volume.
Bollinger Bands may be used to see Movement vs Consolidation Zones (When it’s wide vs narrow). It also may be very useful for seeing where the correction areas are likely to be. Price may bounce between top and bottom of the BOLL, unless perhaps in a pump or dump. The Boom Meter may show you whether it is currently: Dumping, Consolidation or Pumping, along with Boom Meter Bar Colors, may be a good indication if it will break the BOLL. The Middle Line of the BOLL (White Line) may be a very strong support / resistance line. If the price closes above or below it, it may be a good indication of the trend changing (it may be one of the first stages to a pump or dump).
11. Boom Meter Bar Colors:
Boom Meter bar colors may be very useful for seeing when the bar is Overbought or Underbought. There are 6 different types of boom meter bar colors, they are:
Dark Green: RSI may be very Overbought and price going UP (May be in a big pump. NOTICE, chance of small dump correction if Cherry Red bar appears).
Light Green: RSI may be slightly Overbought and price going UP (chance of small pump).
Light Purple: RSI may be very Underbought and price going UP (May have chance of small correction).
Dark Red: RSI may be very Underbought and price going DOWN (May be in a big dump. NOTICE, chance of small pump correction if Light Purple bar appears).
Light Orange: RSI may be slightly Underbought and price going DOWN (chance of small dump).
Cherry Red: RSI may be very Overbought and price going DOWN (Chance of small correction).
12. True Value Zone:
True Value Zones display zones that represent ranges to show what the price may truly belong within. They may be very useful for knowing if the Price is currently not valued correctly, which generally means a correction may happen soon. True Value Zones can swap from Bullish to Bearish and are represented by Red for Bearish and Green for Bullish. For example, if the price is ABOVE and OUTSIDE of the True Value Zone, this means it may be very overvalued and might correct to go back inside the True Value Zone. This correction may be done by either dumping in price back into the zone, or consolidating horizontally back into it over a longer period of time. Vice Versa is also true if it is BELOW and OUTSIDE of the True Value Zone.
13. Bar Strength Index:
Bar Strength Index may display how Bullish/Bearish the current bar is. The strength is important to help see if a pump may be losing momentum or vice versa if a dump may correct. Keep in mind, the Bar Strength Index does a small 'refresh' to account for new bars. It may help to keep the Index more accurate.
14. Volume Profile:
Volume Profiles may be important to know where the Horizontal Support/Resistance is in Price base on Volume. Our Volume Profile may identify the point where the most volume has occurred within the most relevant timeframe. Volume Profiles are helpful at identifying where Whales have their orders placed. The reason why they are so helpful at identifying whales is when the volume is profiled to a specific area, there may likely be lots of Limit Buy and/or Sells around there. Limit Buys may act as Support and Limit Sells may act as Resistance. It may be very useful to know where these lie within the price, similar to looking at Order Book Data for Whale locations.
If you have any questions, comments, ideas or concerns please don't hesitate to contact us.
HAPPY TRADING!

Liquidity prints / quantifytools- Overview
Liquidity prints detect points in price where buyers or sellers are being effectively absorbed, indicative of price being on a path of resistance. In other words, the prints detect points in price where hard way is likely in current motion and easy way in the opposite. Prints with ideal attributes such as prints into extended trends or into a deviation are marked separately as print confluence. Prints with important or multiple confluence factors give further color into potential strength and duration of print influence. Liquidity prints are detected using an universally applicable method based on price action (OHLC). The prints principally work on any chart, whether that is equities, currencies, cryptocurrencies or commodities, charts with volume data or no volume data. Essentially any asset that can be considered an ordinary speculative asset. The prints also work on any timeframe, from second charts to monthly charts. Liquidity prints are activated real-time after a confirmed bar close, meaning they are not repainted and can be interacted with once a confirmation is in place.
Liquidity prints are based on the premise that price acts a certain way when sufficient liquidity is found, in other words when price shows exhaustion of some sort. A simple example of such price action are wicks, attempted moves that were rejected within the same time period where move was initiated. This type of price action typically takes place when price is close to or at meaningful amount of bids in an order book. There's no guarantee the stacked orders can't be just cleared and moved through, but at face value it does not make sense to expect price moving the hard way. When sufficient amount of characteristics in price action are hinting proximate liquidity, a print is activated. As a barometer for print feedback quality, short term impact on price rate of change and likelihood of print lows/highs being revisited during backtesting period are tracked for each print. Peak increase/decrease during backtesting period is also recorded and added to average calculations. Liquidity prints can also be backtested using any script that has a source input, including mechanic strategies utilizing Tradingview's native backtester.
Key takeaways
Liquidity prints are activated when price is showing signs of grind against path of greater resistance, leaving path of least resistance to the opposite direction.
Liquidity prints with ideal attributes are marked separately as print confluence, giving further color into print strength and duration of influence.
Liquidity prints are backtested using price rate of change, print invalidation mark and peak magnitude metrics.
Liquidity prints can be backtested and utilized in any other Tradingview script, including mechanic strategies utilizing Tradingview's native backtester.
Liquidity prints are detected using price action based methodology. They principally work on any chart or timeframe, including charts with no volume data.
Liquidity prints are activated real-time after a confirmed bar close and are not repainted.
For practical guide with practical examples, see last section.
Accessing script 🔑
See "Author's instructions" section, found at bottom of the script page.
Disclaimer
Liquidity prints are not buy/sell signals, a standalone trading strategy or financial advice. They also do not substitute knowing how to trade. Example charts and ideas shown for use cases are textbook examples under ideal conditions, not guaranteed to repeat as they are presented. Liquidity prints notify when a set of conditions (various reversal patterns, overextended price etc.) are in place from a purely technical standpoint. Liquidity prints should be viewed as one tool providing one kind of evidence, to be used in conjunction with other means of analysis.
Liquidity print quality is backtested using metrics that reasonably depict their expected behaviour, such as historical likelihood of price slowing down or turning shortly after a print. Print quality metrics are not intended to be elaborate and perfect, but to serve as a general barometer for print feedback. Backtesting is done first and foremost to exclude scenarios where prints clearly don't work or work suboptimally, in which case they can't be considered as valid evidence. Even when print metrics indicate historical reactions of good quality, price impact can and inevitably does deviate from the expected. Past results do not guarantee future performance.
- Example charts
Chart #1: BTCUSDT
Chart #2: DXY
Chart #3: NQ futures
Chart #4: Crude oil futures
Chart #5: Custom timeframes
- Print confluence
Attributes that make prints ideal in one way or another are marked separately as print confluence, giving clue into potential strength and duration of print influence. Prints with important or multiple confluence factors can be considered as heavier and more reliable evidence of price being on a path of resistance. Users can choose which confluence to show/hide (by default all) and set a minimum amount of confluence for confluence text to activate (by default 1).
Confluence type #1: Trend extensions
Price trending for abnormally long time doesn't happen too often and requires effort to sustain. Prints taking place at extended trends often have a longer duration influence, indicating a potential larger scale topping/bottoming process being close. Trend extension confluence is indicated using a numbered label, equal to amount of bars price has been in a trending state.
Confluence type #2: Consecutive prints
Prints that take place consecutively imply heavier resistance ahead, as required conditions trigger multiple times within a short period. Consecutive prints tend to lead to more clean, aggressive and heavier magnitude reactions relative to prints with no confluence. Consecutive print confluence is indicated using a numbered label with an x in front, equal to amount of prints that have taken place consecutively.
Confluence type #3: Deviations
When price closes above/below prior print highs/lows and closes right back in with a print, odds are some market participants are stuck in an awkward position. When market participants are stuck, potential for a snowball effect of covering underwater positions is higher, driving price further away. Prints into deviations act similarly to consecutive prints, elevating potential for more aggressive reactions relative to prints with no confluence. Deviation confluence is indicated using a label with a curve symbol.
- Backtesting
Built-in backtesting is based on metrics that are considered to reasonably quantify expected behaviour of prints. Main purpose of the metrics is to form a general barometer for monitoring whether or not prints can be viewed as valid evidence. When prints are clearly not working optimally, one should adjust expectations accordingly or take action to improve print performance. To make any valid conclusions of print performance, sample size should also be significant enough to eliminate randomness effectively. If sample size on any individual chart is insufficient, one should view feedback scores on multiple correlating and comparable charts to make up for the loss.
For more elaborate backtesting, prints can be used in any other script that has a source input, including fully mechanic strategies utilizing Tradingview's native backtester. Print plots are created separately for regular prints and prints with each type of confluence.
Print feedback
Print feedback is monitored for 3 bars following a print. Feedback is considered to be 100% successful when all 3/3 bars show a supportive reaction. When 2/3 bars are supportive, feedback rate is 66%, 1/3 bars = 33% and 0/3 = 0%. After print backtesting period is finished, performance of given print is added to average calculations.
Metric #1 : Rate of change
Rate of change used for backtesting is based on OHLC4 average (open + high + low + close / 4) with a length of 3. Rate of change trending up is considered valid feedback for bullish liquidity prints, trending down for bearish liquidity prints. Note that trending rate of change does not always correlate with trending price, but sometimes simply means current trend in price is slowing down.
Metric #2 : Invalidation mark
Print invalidation marks are set at print low/high with a little bit of "wiggle room". Wiggle room applied is always 1/10th of print bar range. E.g. for a bullish print with bar range of 2%, invalidation mark is set to 0.20% below print low. For most prints this is practically at print low/high, but in the case of prints with high volatility a more noticeable excess is given, due to the expectation of greater adverse reaction without necessarily meaning invalidation. A low being above invalidation mark is considered valid feedback for bullish prints and a high being below invalidation mark for bearish prints.
Metric #3 : Peak increase/decrease
Unlike prior two metrics, peak increase/decrease is not feedback the same way, but rather an assisting factor to be viewed with feedback scores. Peak increase/decrease is measured from print close to highest high/lowest low during backtesting period and added to average calculations
Feedback scores
When liquidity prints are working optimally, quality threshold for both feedback metrics are met. By default, threshold is set to 66%, indicating valid feedback on 2/3 of backtesting periods on average. When threshold is met, a tick will appear next to feedback scores, otherwise an exclamation mark indicating suboptimal performance on either or both.
By default, the prints are filtered as little as possible, idea behind being that it is better to have more poor prints filtered with discretion/mechanically afterwards than potentially filtering too much from the get go. Sometimes filtering is insufficient, leading to failed reactions beyond a tolerable level. When this is the case, print sensitivity can be adjusted via input menu, separately for bullish and bearish prints. Print filter sensitivity ranges from 1 to 5, by default set to 1. Lower sensitivity sets looser criteria for print activation, higher sensitivity sets stricter criteria. For most charts and timeframes default sensitivity works just fine, but when this is not the case, filters can be tweaked in search of better settings. If feedback score threshold is met, it's better to keep filter sensitivity intact and use discretion, which is much more nuanced and capable than any mechanical process. If feedback scores are still insufficient after tweaking, depending on the severity of lack, prints should be vetted extra carefully using other means of analysis or simply avoided.
Verifying backtest calculations
Backtest metrics can be toggled on via input menu, separately for bullish and bearish prints. When toggled on, both cumulative and average counters used in print backtesting will appear on "Data Window" tab. Calculation states are shown at a point in time where cursor is hovered. E.g. when hovering cursor on 4th of January 2021, backtest calculations as they were during this date will be shown. Backtest calculations are updated after backtest period of a print has finished (3 bars). Assisting backtest visuals are also plotted on chart to ease inspection.
- Alerts
Available alerts are the following.
- Bullish/bearish liquidity print
- Bullish/bearish liquidity print with specified print confluence
- Bullish/bearish liquidity print with set minimum print confluence amount exceeded
- Visuals
Visual impact of prints can be managed by adjusting width and length via input menu. Length of prints is available in 3 modes (1-3 from shortest to longest) and width in 10 modes (1-10 from narrowest to widest).
Print confluence text can be embedded inside print nodes, eliminating visuals outside the chart.
Metric table is available in two themes, Classic and Stealth.
Metric table can be offsetted horizontally or vertically from any four corners of the chart, allowing space for tables from other scripts.
Table sizes, label sizes and colors are fully customizable via input menu.
-Practical guide
Key in maximizing success with prints is knowing when they are likely reliable and when not. In general, the more volatile and ranging the market regime, the better liquidity prints will work. Any type of volatile spike in price, parabola or a clean range is where liquidity prints provide optimal feedback. On the other hand low volatility and trending environments are suboptimal and tend to provide more mute/lagged or completely failed feedback. Anomalies such as market wide crashes are also environments where prints can't be expected to work reliably.
Being aware of events on multiple timeframes is crucial for establishing bias for any individual timeframe. Not often it makes sense to go against higher timeframe moves on lower timeframes and this principle of timeframe hierarchy also applies to prints. In other words, higher timeframe prints dictate likelihood of successful prints on lower timeframes. If hard way on a weekly chart is up, same likely applies to daily chart during weekly print influence time. In such scenarios, it's best to not swim in upstream and avoid contradicting lower timeframe prints, at least until clear evidence suggesting otherwise has developed.
Points in price where it anyway makes sense to favor one side over the other are key points of confluence for prints as well. Prints into clean range highs/lows with clean taps can be valuable for optimal entry timing. This is especially true if simultaneously previous pivot gets taken out, increasing odds of liquidity indicated by a print being swept stop-losses.
Prints that don't match underlying bias (e.g. bullish prints at range high, bearish prints at range low) should be avoided until clear evidence has developed favoring them, such as a convincing break through a level followed by a re-test.
Prints that are immediately rejected aggressively are more likely prints that end up failing. Next bar following a print closing below print lows/above print highs is a strong hint of print failure. To consider print still valid in such cases, there should be quick and clear defending of print lows/highs. Failed prints are an inevitable bummer, but never useless. Failed prints are ideal for future reference, as liquidity still likely exists there. Re-tests into these levels often provide sensible entries.
Stacked confluence doesn't come too often and is worth paying special attention to, as multiple benefitting factors are in place simultaneously.
From a more zoomed out perspective, any larger zone with multiple prints taking place inside are potential topping/bottoming processes taking place, also worth paying attention to.
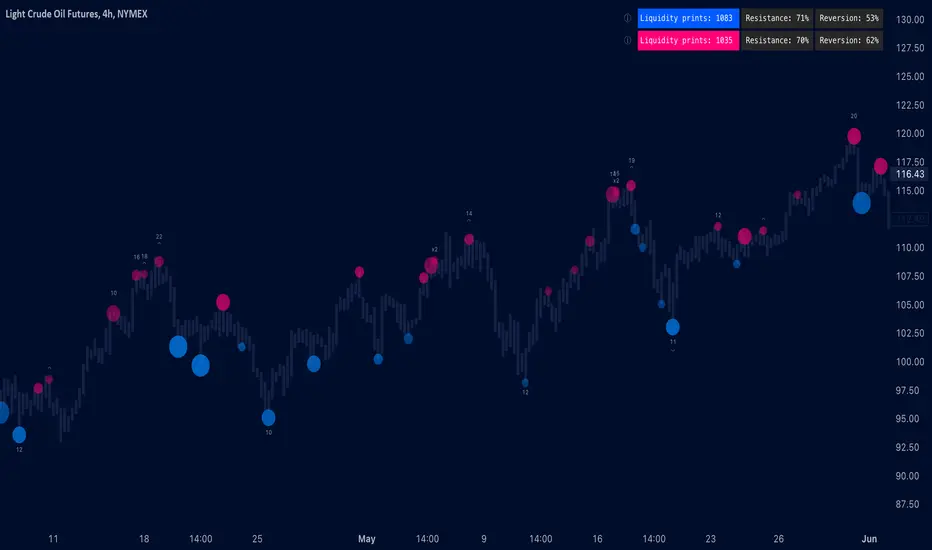
GKD-C Volatility-Adaptive Rapid RSI T3 [Loxx]Giga Kaleidoscope GKD-C Volatility-Adaptive Rapid RSI T3 is a Confirmation module included in Loxx's "Giga Kaleidoscope Modularized Trading System".
█ GKD-C Volatility-Adaptive Rapid RSI T3
Adaptive Momentum: Mastering Market Dynamics with Advanced RSI Techniques
The Volatility-Adaptive Rapid RSI T3 is a sophisticated technical indicator that combines the concepts of Rapid RSI, Volatility Adaptation, and T3 smoothing. This combination results in a more responsive, accurate, and adaptable momentum oscillator compared to the regular RSI.
The Rapid RSI is a variation of the RSI designed to provide faster and more responsive signals. It does this by modifying the way average gains and losses are calculated, using a simple moving average (SMA) instead of an exponential moving average (EMA). This makes the Rapid RSI more sensitive to recent price changes, allowing traders to identify overbought and oversold conditions more quickly.
Volatility adaptation is a concept that adjusts the parameters of an indicator based on the current market volatility. In the context of the Volatility-Adaptive Rapid RSI T3, the volatility is calculated using the standard deviation of price changes over a specified period. This value is then used to adjust the T3 smoothing period, making the indicator more adaptive to changing market conditions. When the market is volatile, the indicator will respond more quickly to price changes, while in less volatile markets, the indicator will be less sensitive, reducing the likelihood of false signals.
T3 smoothing, developed by Tim Tilson, is a powerful and flexible moving average technique that aims to reduce lag and improve the responsiveness of an indicator. It utilizes a combination of multiple exponential moving averages with varying degrees of weighting to create a smoother and more accurate representation of the underlying data. The T3 smoothing method is applied to the price data before the Rapid RSI calculation, enhancing the overall responsiveness of the indicator.
By combining these three concepts, the Volatility-Adaptive Rapid RSI T3 offers several advantages over the regular RSI:
1. Faster and more responsive signals: The Rapid RSI and T3 smoothing components allow the indicator to respond more quickly to price changes, potentially leading to earlier entry and exit points.
2. Adaptability to market conditions: The volatility adaptation feature enables the indicator to adjust its sensitivity based on the current market volatility. This helps to reduce false signals in less volatile markets and increase responsiveness in more volatile markets.
2. Smoother representation of price data: The T3 smoothing technique provides a more accurate and smoother representation of the underlying data, making it easier to identify trends and potential reversals.
In conclusion, the Volatility-Adaptive Rapid RSI T3 is a powerful technical indicator that offers several improvements over the regular RSI. Its responsiveness, adaptability, and smoothing capabilities make it a valuable tool for traders seeking to identify overbought and oversold conditions more accurately. However, it is essential to remember that no indicator is perfect, and using the Volatility-Adaptive Rapid RSI T3 in conjunction with other technical indicators and analysis tools can provide more reliable trading signals.
Additional Features
This indicator allows you to select from 33 source types. They are as follows:
Close
Open
High
Low
Median
Typical
Weighted
Average
Average Median Body
Trend Biased
Trend Biased (Extreme)
HA Close
HA Open
HA High
HA Low
HA Median
HA Typical
HA Weighted
HA Average
HA Average Median Body
HA Trend Biased
HA Trend Biased (Extreme)
HAB Close
HAB Open
HAB High
HAB Low
HAB Median
HAB Typical
HAB Weighted
HAB Average
HAB Average Median Body
HAB Trend Biased
HAB Trend Biased (Extreme)
What are Heiken Ashi "better" candles?
Heiken Ashi "better" candles are a modified version of the standard Heiken Ashi candles, which are a popular charting technique used in technical analysis. Heiken Ashi candles help traders identify trends and potential reversal points by smoothing out price data and reducing market noise. The "better formula" was proposed by Sebastian Schmidt in an article published by BNP Paribas in Warrants & Zertifikate, a German magazine, in August 2004. The aim of this formula is to further improve the smoothing of the Heiken Ashi chart and enhance its effectiveness in identifying trends and reversals.
Standard Heiken Ashi candles are calculated using the following formulas:
Heiken Ashi Close = (Open + High + Low + Close) / 4
Heiken Ashi Open = (Previous Heiken Ashi Open + Previous Heiken Ashi Close) / 2
Heiken Ashi High = Max (High, Heiken Ashi Open, Heiken Ashi Close)
Heiken Ashi Low = Min (Low, Heiken Ashi Open, Heiken Ashi Close)
The "better formula" modifies the standard Heiken Ashi calculation by incorporating additional smoothing, which can help reduce noise and make it easier to identify trends and reversals. The modified formulas for Heiken Ashi "better" candles are as follows:
Better Heiken Ashi Close = (Open + High + Low + Close) / 4
Better Heiken Ashi Open = (Previous Better Heiken Ashi Open + Previous Better Heiken Ashi Close) / 2
Better Heiken Ashi High = Max (High, Better Heiken Ashi Open, Better Heiken Ashi Close)
Better Heiken Ashi Low = Min (Low, Better Heiken Ashi Open, Better Heiken Ashi Close)
Smoothing Factor = 2 / (N + 1), where N is the chosen period for smoothing
Smoothed Better Heiken Ashi Open = (Better Heiken Ashi Open * Smoothing Factor) + (Previous Smoothed Better Heiken Ashi Open * (1 - Smoothing Factor))
Smoothed Better Heiken Ashi Close = (Better Heiken Ashi Close * Smoothing Factor) + (Previous Smoothed Better Heiken Ashi Close * (1 - Smoothing Factor))
The smoothed Better Heiken Ashi Open and Close values are then used to calculate the smoothed Better Heiken Ashi High and Low values, resulting in "better" candles that provide a clearer representation of the market trend and potential reversal points.
It's important to note that, like any other technical analysis tool, Heiken Ashi "better" candles are not foolproof and should be used in conjunction with other indicators and analysis techniques to make well-informed trading decisions.
Heiken Ashi "better" candles, as mentioned previously, provide a clearer representation of market trends and potential reversal points by reducing noise and smoothing out price data. When using these candles in conjunction with other technical analysis tools and indicators, traders can gain valuable insights into market behavior and make more informed decisions.
To effectively use Heiken Ashi "better" candles in your trading strategy, consider the following tips:
Trend Identification: Heiken Ashi "better" candles can help you identify the prevailing trend in the market. When the majority of the candles are green (or another color, depending on your chart settings) and there are no or few lower wicks, it may indicate a strong uptrend. Conversely, when the majority of the candles are red (or another color) and there are no or few upper wicks, it may signal a strong downtrend.
Trend Reversals: Look for potential trend reversals when a change in the color of the candles occurs, especially when accompanied by longer wicks. For example, if a green candle with a long lower wick is followed by a red candle, it could indicate a bearish reversal. Similarly, a red candle with a long upper wick followed by a green candle may suggest a bullish reversal.
Support and Resistance: You can use Heiken Ashi "better" candles to identify potential support and resistance levels. When the candles are consistently moving in one direction and then suddenly change color with longer wicks, it could indicate the presence of a support or resistance level.
Stop-Loss and Take-Profit: Using Heiken Ashi "better" candles can help you manage risk by determining optimal stop-loss and take-profit levels. For instance, you can place your stop-loss below the low of the most recent green candle in an uptrend or above the high of the most recent red candle in a downtrend.
Confirming Signals: Heiken Ashi "better" candles should be used in conjunction with other technical indicators, such as moving averages, oscillators, or chart patterns, to confirm signals and improve the accuracy of your analysis.
In this implementation, you have the choice of AMA, KAMA, or T3 smoothing. These are as follows:
Kaufman Adaptive Moving Average (KAMA)
The Kaufman Adaptive Moving Average (KAMA) is a type of adaptive moving average used in technical analysis to smooth out price fluctuations and identify trends. The KAMA adjusts its smoothing factor based on the market's volatility, making it more responsive in volatile markets and smoother in calm markets. The KAMA is calculated using three different efficiency ratios that determine the appropriate smoothing factor for the current market conditions. These ratios are based on the noise level of the market, the speed at which the market is moving, and the length of the moving average. The KAMA is a popular choice among traders who prefer to use adaptive indicators to identify trends and potential reversals.
Adaptive Moving Average
The Adaptive Moving Average (AMA) is a type of moving average that adjusts its sensitivity to price movements based on market conditions. It uses a ratio between the current price and the highest and lowest prices over a certain lookback period to determine its level of smoothing. The AMA can help reduce lag and increase responsiveness to changes in trend direction, making it useful for traders who want to follow trends while avoiding false signals. The AMA is calculated by multiplying a smoothing constant with the difference between the current price and the previous AMA value, then adding the result to the previous AMA value.
T3
The T3 moving average is a type of technical indicator used in financial analysis to identify trends in price movements. It is similar to the Exponential Moving Average (EMA) and the Double Exponential Moving Average (DEMA), but uses a different smoothing algorithm.
The T3 moving average is calculated using a series of exponential moving averages that are designed to filter out noise and smooth the data. The resulting smoothed data is then weighted with a non-linear function to produce a final output that is more responsive to changes in trend direction.
The T3 moving average can be customized by adjusting the length of the moving average, as well as the weighting function used to smooth the data. It is commonly used in conjunction with other technical indicators as part of a larger trading strategy.
█ Giga Kaleidoscope Modularized Trading System
Core components of an NNFX algorithmic trading strategy
The NNFX algorithm is built on the principles of trend, momentum, and volatility. There are six core components in the NNFX trading algorithm:
1. Volatility - price volatility; e.g., Average True Range, True Range Double, Close-to-Close, etc.
2. Baseline - a moving average to identify price trend
3. Confirmation 1 - a technical indicator used to identify trends
4. Confirmation 2 - a technical indicator used to identify trends
5. Continuation - a technical indicator used to identify trends
6. Volatility/Volume - a technical indicator used to identify volatility/volume breakouts/breakdown
7. Exit - a technical indicator used to determine when a trend is exhausted
What is Volatility in the NNFX trading system?
In the NNFX (No Nonsense Forex) trading system, ATR (Average True Range) is typically used to measure the volatility of an asset. It is used as a part of the system to help determine the appropriate stop loss and take profit levels for a trade. ATR is calculated by taking the average of the true range values over a specified period.
True range is calculated as the maximum of the following values:
-Current high minus the current low
-Absolute value of the current high minus the previous close
-Absolute value of the current low minus the previous close
ATR is a dynamic indicator that changes with changes in volatility. As volatility increases, the value of ATR increases, and as volatility decreases, the value of ATR decreases. By using ATR in NNFX system, traders can adjust their stop loss and take profit levels according to the volatility of the asset being traded. This helps to ensure that the trade is given enough room to move, while also minimizing potential losses.
Other types of volatility include True Range Double (TRD), Close-to-Close, and Garman-Klass
What is a Baseline indicator?
The baseline is essentially a moving average, and is used to determine the overall direction of the market.
The baseline in the NNFX system is used to filter out trades that are not in line with the long-term trend of the market. The baseline is plotted on the chart along with other indicators, such as the Moving Average (MA), the Relative Strength Index (RSI), and the Average True Range (ATR).
Trades are only taken when the price is in the same direction as the baseline. For example, if the baseline is sloping upwards, only long trades are taken, and if the baseline is sloping downwards, only short trades are taken. This approach helps to ensure that trades are in line with the overall trend of the market, and reduces the risk of entering trades that are likely to fail.
By using a baseline in the NNFX system, traders can have a clear reference point for determining the overall trend of the market, and can make more informed trading decisions. The baseline helps to filter out noise and false signals, and ensures that trades are taken in the direction of the long-term trend.
What is a Confirmation indicator?
Confirmation indicators are technical indicators that are used to confirm the signals generated by primary indicators. Primary indicators are the core indicators used in the NNFX system, such as the Average True Range (ATR), the Moving Average (MA), and the Relative Strength Index (RSI).
The purpose of the confirmation indicators is to reduce false signals and improve the accuracy of the trading system. They are designed to confirm the signals generated by the primary indicators by providing additional information about the strength and direction of the trend.
Some examples of confirmation indicators that may be used in the NNFX system include the Bollinger Bands, the MACD (Moving Average Convergence Divergence), and the MACD Oscillator. These indicators can provide information about the volatility, momentum, and trend strength of the market, and can be used to confirm the signals generated by the primary indicators.
In the NNFX system, confirmation indicators are used in combination with primary indicators and other filters to create a trading system that is robust and reliable. By using multiple indicators to confirm trading signals, the system aims to reduce the risk of false signals and improve the overall profitability of the trades.
What is a Continuation indicator?
In the NNFX (No Nonsense Forex) trading system, a continuation indicator is a technical indicator that is used to confirm a current trend and predict that the trend is likely to continue in the same direction. A continuation indicator is typically used in conjunction with other indicators in the system, such as a baseline indicator, to provide a comprehensive trading strategy.
What is a Volatility/Volume indicator?
Volume indicators, such as the On Balance Volume (OBV), the Chaikin Money Flow (CMF), or the Volume Price Trend (VPT), are used to measure the amount of buying and selling activity in a market. They are based on the trading volume of the market, and can provide information about the strength of the trend. In the NNFX system, volume indicators are used to confirm trading signals generated by the Moving Average and the Relative Strength Index. Volatility indicators include Average Direction Index, Waddah Attar, and Volatility Ratio. In the NNFX trading system, volatility is a proxy for volume and vice versa.
By using volume indicators as confirmation tools, the NNFX trading system aims to reduce the risk of false signals and improve the overall profitability of trades. These indicators can provide additional information about the market that is not captured by the primary indicators, and can help traders to make more informed trading decisions. In addition, volume indicators can be used to identify potential changes in market trends and to confirm the strength of price movements.
What is an Exit indicator?
The exit indicator is used in conjunction with other indicators in the system, such as the Moving Average (MA), the Relative Strength Index (RSI), and the Average True Range (ATR), to provide a comprehensive trading strategy.
The exit indicator in the NNFX system can be any technical indicator that is deemed effective at identifying optimal exit points. Examples of exit indicators that are commonly used include the Parabolic SAR, the Average Directional Index (ADX), and the Chandelier Exit.
The purpose of the exit indicator is to identify when a trend is likely to reverse or when the market conditions have changed, signaling the need to exit a trade. By using an exit indicator, traders can manage their risk and prevent significant losses.
In the NNFX system, the exit indicator is used in conjunction with a stop loss and a take profit order to maximize profits and minimize losses. The stop loss order is used to limit the amount of loss that can be incurred if the trade goes against the trader, while the take profit order is used to lock in profits when the trade is moving in the trader's favor.
Overall, the use of an exit indicator in the NNFX trading system is an important component of a comprehensive trading strategy. It allows traders to manage their risk effectively and improve the profitability of their trades by exiting at the right time.
How does Loxx's GKD (Giga Kaleidoscope Modularized Trading System) implement the NNFX algorithm outlined above?
Loxx's GKD v1.0 system has five types of modules (indicators/strategies). These modules are:
1. GKD-BT - Backtesting module (Volatility, Number 1 in the NNFX algorithm)
2. GKD-B - Baseline module (Baseline and Volatility/Volume, Numbers 1 and 2 in the NNFX algorithm)
3. GKD-C - Confirmation 1/2 and Continuation module (Confirmation 1/2 and Continuation, Numbers 3, 4, and 5 in the NNFX algorithm)
4. GKD-V - Volatility/Volume module (Confirmation 1/2, Number 6 in the NNFX algorithm)
5. GKD-E - Exit module (Exit, Number 7 in the NNFX algorithm)
(additional module types will added in future releases)
Each module interacts with every module by passing data between modules. Data is passed between each module as described below:
GKD-B => GKD-V => GKD-C(1) => GKD-C(2) => GKD-C(Continuation) => GKD-E => GKD-BT
That is, the Baseline indicator passes its data to Volatility/Volume. The Volatility/Volume indicator passes its values to the Confirmation 1 indicator. The Confirmation 1 indicator passes its values to the Confirmation 2 indicator. The Confirmation 2 indicator passes its values to the Continuation indicator. The Continuation indicator passes its values to the Exit indicator, and finally, the Exit indicator passes its values to the Backtest strategy.
This chaining of indicators requires that each module conform to Loxx's GKD protocol, therefore allowing for the testing of every possible combination of technical indicators that make up the six components of the NNFX algorithm.
What does the application of the GKD trading system look like?
Example trading system:
Backtest: Strategy with 1-3 take profits, trailing stop loss, multiple types of PnL volatility, and 2 backtesting styles
Baseline: Hull Moving Average
Volatility/Volume: Hurst Exponent
Confirmation 1: Volatility-Adaptive Rapid RSI T3 as shown on the chart above
Confirmation 2: Williams Percent Range
Continuation: Volatility-Adaptive Rapid RSI T3
Exit: Rex Oscillator
Each GKD indicator is denoted with a module identifier of either: GKD-BT, GKD-B, GKD-C, GKD-V, or GKD-E. This allows traders to understand to which module each indicator belongs and where each indicator fits into the GKD protocol chain.
Giga Kaleidoscope Modularized Trading System Signals (based on the NNFX algorithm)
Standard Entry
1. GKD-C Confirmation 1 Signal
2. GKD-B Baseline agrees
3. Price is within a range of 0.2x Volatility and 1.0x Volatility of the Goldie Locks Mean
4. GKD-C Confirmation 2 agrees
5. GKD-V Volatility/Volume agrees
Baseline Entry
1. GKD-B Baseline signal
2. GKD-C Confirmation 1 agrees
3. Price is within a range of 0.2x Volatility and 1.0x Volatility of the Goldie Locks Mean
4. GKD-C Confirmation 2 agrees
5. GKD-V Volatility/Volume agrees
6. GKD-C Confirmation 1 signal was less than 7 candles prior
Volatility/Volume Entry
1. GKD-V Volatility/Volume signal
2. GKD-C Confirmation 1 agrees
3. Price is within a range of 0.2x Volatility and 1.0x Volatility of the Goldie Locks Mean
4. GKD-C Confirmation 2 agrees
5. GKD-B Baseline agrees
6. GKD-C Confirmation 1 signal was less than 7 candles prior
Continuation Entry
1. Standard Entry, Baseline Entry, or Pullback; entry triggered previously
2. GKD-B Baseline hasn't crossed since entry signal trigger
3. GKD-C Confirmation Continuation Indicator signals
4. GKD-C Confirmation 1 agrees
5. GKD-B Baseline agrees
6. GKD-C Confirmation 2 agrees
1-Candle Rule Standard Entry
1. GKD-C Confirmation 1 signal
2. GKD-B Baseline agrees
3. Price is within a range of 0.2x Volatility and 1.0x Volatility of the Goldie Locks Mean
Next Candle:
1. Price retraced (Long: close < close or Short: close > close )
2. GKD-B Baseline agrees
3. GKD-C Confirmation 1 agrees
4. GKD-C Confirmation 2 agrees
5. GKD-V Volatility/Volume agrees
1-Candle Rule Baseline Entry
1. GKD-B Baseline signal
2. GKD-C Confirmation 1 agrees
3. Price is within a range of 0.2x Volatility and 1.0x Volatility of the Goldie Locks Mean
4. GKD-C Confirmation 1 signal was less than 7 candles prior
Next Candle:
1. Price retraced (Long: close < close or Short: close > close )
2. GKD-B Baseline agrees
3. GKD-C Confirmation 1 agrees
4. GKD-C Confirmation 2 agrees
5. GKD-V Volatility/Volume Agrees
1-Candle Rule Volatility/Volume Entry
1. GKD-V Volatility/Volume signal
2. GKD-C Confirmation 1 agrees
3. Price is within a range of 0.2x Volatility and 1.0x Volatility of the Goldie Locks Mean
4. GKD-C Confirmation 1 signal was less than 7 candles prior
Next Candle:
1. Price retraced (Long: close < close or Short: close > close)
2. GKD-B Volatility/Volume agrees
3. GKD-C Confirmation 1 agrees
4. GKD-C Confirmation 2 agrees
5. GKD-B Baseline agrees
PullBack Entry
1. GKD-B Baseline signal
2. GKD-C Confirmation 1 agrees
3. Price is beyond 1.0x Volatility of Baseline
Next Candle:
1. Price is within a range of 0.2x Volatility and 1.0x Volatility of the Goldie Locks Mean
2. GKD-C Confirmation 1 agrees
3. GKD-C Confirmation 2 agrees
4. GKD-V Volatility/Volume Agrees
]█ Setting up the GKD
The GKD system involves chaining indicators together. These are the steps to set this up.
Use a GKD-C indicator alone on a chart
1. Inside the GKD-C indicator, change the "Confirmation Type" setting to "Solo Confirmation Simple"
Use a GKD-V indicator alone on a chart
**nothing, it's already useable on the chart without any settings changes
Use a GKD-B indicator alone on a chart
**nothing, it's already useable on the chart without any settings changes
Baseline (Baseline, Backtest)
1. Import the GKD-B Baseline into the GKD-BT Backtest: "Input into Volatility/Volume or Backtest (Baseline testing)"
2. Inside the GKD-BT Backtest, change the setting "Backtest Special" to "Baseline"
Volatility/Volume (Volatility/Volume, Backte st)
1. Inside the GKD-V indicator, change the "Testing Type" setting to "Solo"
2. Inside the GKD-V indicator, change the "Signal Type" setting to "Crossing" (neither traditional nor both can be backtested)
3. Import the GKD-V indicator into the GKD-BT Backtest: "Input into C1 or Backtest"
4. Inside the GKD-BT Backtest, change the setting "Backtest Special" to "Volatility/Volume"
5. Inside the GKD-BT Backtest, a) change the setting "Backtest Type" to "Trading" if using a directional GKD-V indicator; or, b) change the setting "Backtest Type" to "Full" if using a directional or non-directional GKD-V indicator (non-directional GKD-V can only test Longs and Shorts separately)
6. If "Backtest Type" is set to "Full": Inside the GKD-BT Backtest, change the setting "Backtest Side" to "Long" or "Short
7. If "Backtest Type" is set to "Full": To allow the system to open multiple orders at one time so you test all Longs or Shorts, open the GKD-BT Backtest, click the tab "Properties" and then insert a value of something like 10 orders into the "Pyramiding" settings. This will allow 10 orders to be opened at one time which should be enough to catch all possible Longs or Shorts.
Solo Confirmation Simple (Confirmation, Backtest)
1. Inside the GKD-C indicator, change the "Confirmation Type" setting to "Solo Confirmation Simple"
1. Import the GKD-C indicator into the GKD-BT Backtest: "Input into Backtest"
2. Inside the GKD-BT Backtest, change the setting "Backtest Special" to "Solo Confirmation Simple"
Solo Confirmation Complex without Exits (Baseline, Volatility/Volume, Confirmation, Backtest)
1. Inside the GKD-V indicator, change the "Testing Type" setting to "Chained"
2. Import the GKD-B Baseline into the GKD-V indicator: "Input into Volatility/Volume or Backtest (Baseline testing)"
3. Inside the GKD-C indicator, change the "Confirmation Type" setting to "Solo Confirmation Complex"
4. Import the GKD-V indicator into the GKD-C indicator: "Input into C1 or Backtest"
5. Inside the GKD-BT Backtest, change the setting "Backtest Special" to "GKD Full wo/ Exits"
6. Import the GKD-C into the GKD-BT Backtest: "Input into Exit or Backtest"
Solo Confirmation Complex with Exits (Baseline, Volatility/Volume, Confirmation, Exit, Backtest)
1. Inside the GKD-V indicator, change the "Testing Type" setting to "Chained"
2. Import the GKD-B Baseline into the GKD-V indicator: "Input into Volatility/Volume or Backtest (Baseline testing)"
3. Inside the GKD-C indicator, change the "Confirmation Type" setting to "Solo Confirmation Complex"
4. Import the GKD-V indicator into the GKD-C indicator: "Input into C1 or Backtest"
5. Import the GKD-C indicator into the GKD-E indicator: "Input into Exit"
6. Inside the GKD-BT Backtest, change the setting "Backtest Special" to "GKD Full w/ Exits"
7. Import the GKD-E into the GKD-BT Backtest: "Input into Backtest"
Full GKD without Exits (Baseline, Volatility/Volume, Confirmation 1, Confirmation 2, Continuation, Backtest)
1. Inside the GKD-V indicator, change the "Testing Type" setting to "Chained"
2. Import the GKD-B Baseline into the GKD-V indicator: "Input into Volatility/Volume or Backtest (Baseline testing)"
3. Inside the GKD-C 1 indicator, change the "Confirmation Type" setting to "Confirmation 1"
4. Import the GKD-V indicator into the GKD-C 1 indicator: "Input into C1 or Backtest"
5. Inside the GKD-C 2 indicator, change the "Confirmation Type" setting to "Confirmation 2"
6. Import the GKD-C 1 indicator into the GKD-C 2 indicator: "Input into C2"
7. Inside the GKD-C Continuation indicator, change the "Confirmation Type" setting to "Continuation"
8. Inside the GKD-BT Backtest, change the setting "Backtest Special" to "GKD Full wo/ Exits"
9. Import the GKD-E into the GKD-BT Backtest: "Input into Exit or Backtest"
Full GKD with Exits (Baseline, Volatility/Volume, Confirmation 1, Confirmation 2, Continuation, Exit, Backtest)
1. Inside the GKD-V indicator, change the "Testing Type" setting to "Chained"
2. Import the GKD-B Baseline into the GKD-V indicator: "Input into Volatility/Volume or Backtest (Baseline testing)"
3. Inside the GKD-C 1 indicator, change the "Confirmation Type" setting to "Confirmation 1"
4. Import the GKD-V indicator into the GKD-C 1 indicator: "Input into C1 or Backtest"
5. Inside the GKD-C 2 indicator, change the "Confirmation Type" setting to "Confirmation 2"
6. Import the GKD-C 1 indicator into the GKD-C 2 indicator: "Input into C2"
7. Inside the GKD-C Continuation indicator, change the "Confirmation Type" setting to "Continuation"
8. Import the GKD-C Continuation indicator into the GKD-E indicator: "Input into Exit"
9. Inside the GKD-BT Backtest, change the setting "Backtest Special" to "GKD Full w/ Exits"
10. Import the GKD-E into the GKD-BT Backtest: "Input into Backtest"
Baseline + Volatility/Volume (Baseline, Volatility/Volume, Backtest)
1. Inside the GKD-V indicator, change the "Testing Type" setting to "Baseline + Volatility/Volume"
2. Inside the GKD-V indicator, make sure the "Signal Type" setting is set to "Traditional"
3. Import the GKD-B Baseline into the GKD-V indicator: "Input into Volatility/Volume or Backtest (Baseline testing)"
4. Inside the GKD-BT Backtest, change the setting "Backtest Special" to "Baseline + Volatility/Volume"
5. Import the GKD-V into the GKD-BT Backtest: "Input into C1 or Backtest"
6. Inside the GKD-BT Backtest, change the setting "Backtest Type" to "Full". For this backtest, you must test Longs and Shorts separately
7. To allow the system to open multiple orders at one time so you can test all Longs or Shorts, open the GKD-BT Backtest, click the tab "Properties" and then insert a value of something like 10 orders into the "Pyramiding" settings. This will allow 10 orders to be opened at one time which should be enough to catch all possible Longs or Shorts.
Requirements
Inputs
Confirmation 1: GKD-V Volatility / Volume indicator
Confirmation 2: GKD-C Confirmation indicator
Continuation: GKD-C Confirmation indicator
Solo Confirmation Simple: GKD-B Baseline
Solo Confirmation Complex: GKD-V Volatility / Volume indicator
Solo Confirmation Super Complex: GKD-V Volatility / Volume indicator
Stacked 1: None
Stacked 2+: GKD-C, GKD-V, or GKD-B Stacked 1
Outputs
Confirmation 1: GKD-C Confirmation 2 indicator
Confirmation 2: GKD-C Continuation indicator
Continuation: GKD-E Exit indicator
Solo Confirmation Simple: GKD-BT Backtest
Solo Confirmation Complex: GKD-BT Backtest or GKD-E Exit indicator
Solo Confirmation Super Complex: GKD-C Continuation indicator
Stacked 1: GKD-C, GKD-V, or GKD-B Stacked 2+
Stacked 2+: GKD-C, GKD-V, or GKD-B Stacked 2+ or GKD-BT Backtest
Additional features will be added in future releases.

GKD-C Sentiment Zone Oscillator [Loxx]Giga Kaleidoscope GKD-C Sentiment Zone Oscillator is a Confirmation module included in Loxx's "Giga Kaleidoscope Modularized Trading System".
█ GKD-C Sentiment Zone Oscillator
The Sentiment Zone Oscillator (SZO) is a technical indicator used in financial markets to measure the sentiment of traders and investors. It is primarily used to identify potential market reversals and overbought or oversold conditions, by analyzing the underlying sentiment of market participants. The SZO was developed by Walid Khalil and David Steckler and was first introduced in the Stocks & Commodities magazine in May 2011.
The SZO is calculated using a combination of moving averages and the Rate of Change (ROC) indicator. The basic idea behind the SZO is to compare the current price to its recent average price and then normalize this value using a moving average. The resulting oscillator ranges between -1 and 1, where positive values indicate bullish sentiment and negative values indicate bearish sentiment. Here's a step-by-step explanation of how to calculate the SZO:
Choose the time period for the calculation. The default period is 14 days, but you can adjust this to fit your trading strategy.
1. Calculate the Rate of Change (ROC) for the chosen period. The ROC is calculated as the percentage change in price from the current period to the previous period. The formula for ROC is:
2. ROC = * 100
3. Calculate the Simple Moving Average (SMA) of the ROC for the chosen period. The SMA is the average of the ROC values for the given period.
4. Calculate the Exponential Moving Average (EMA) of the SMA for the chosen period. The EMA is a type of weighted moving average that gives more weight to recent data points. The formula for EMA is:
EMA = (Current SMA - Previous EMA) * (2 / (Period + 1)) + Previous EMA
5. Calculate the Sentiment Zone Oscillator (SZO) by normalizing the EMA value between -1 and 1. The formula for SZO is:
SZO = (EMA - 50) / 50
Interpretation of the Sentiment Zone Oscillator:
-Values above 0.5 indicate strong bullish sentiment, suggesting that the market may be overbought and a potential reversal could occur.
-Values below -0.5 indicate strong bearish sentiment, suggesting that the market may be oversold and a potential reversal could occur.
-Values between -0.5 and 0.5 indicate neutral sentiment, meaning that the market is in a consolidation phase and no clear trend is present.
Traders and investors can use the SZO to identify potential entry and exit points in the market, as well as to gauge the overall market sentiment. It is important to note that the SZO should not be used in isolation, but rather as a complementary tool alongside other technical indicators and fundamental analysis.
This version expands on typical calculation for SZO by allowing 63+ different smoothing methods for price and the SZO. This allows the user to choose something different than the standard SMA and EMA. This version also expands the interpretation of the SZO by allowing the user to select from varoius signal types: Middle, Quantile middle, Quantile Levels, Floating Levels, or Floating middle.
Additional Features
This indicator allows you to select from 33 source types. They are as follows:
Close
Open
High
Low
Median
Typical
Weighted
Average
Average Median Body
Trend Biased
Trend Biased (Extreme)
HA Close
HA Open
HA High
HA Low
HA Median
HA Typical
HA Weighted
HA Average
HA Average Median Body
HA Trend Biased
HA Trend Biased (Extreme)
HAB Close
HAB Open
HAB High
HAB Low
HAB Median
HAB Typical
HAB Weighted
HAB Average
HAB Average Median Body
HAB Trend Biased
HAB Trend Biased (Extreme)
What are Heiken Ashi "better" candles?
Heiken Ashi "better" candles are a modified version of the standard Heiken Ashi candles, which are a popular charting technique used in technical analysis. Heiken Ashi candles help traders identify trends and potential reversal points by smoothing out price data and reducing market noise. The "better formula" was proposed by Sebastian Schmidt in an article published by BNP Paribas in Warrants & Zertifikate, a German magazine, in August 2004. The aim of this formula is to further improve the smoothing of the Heiken Ashi chart and enhance its effectiveness in identifying trends and reversals.
Standard Heiken Ashi candles are calculated using the following formulas:
Heiken Ashi Close = (Open + High + Low + Close) / 4
Heiken Ashi Open = (Previous Heiken Ashi Open + Previous Heiken Ashi Close) / 2
Heiken Ashi High = Max (High, Heiken Ashi Open, Heiken Ashi Close)
Heiken Ashi Low = Min (Low, Heiken Ashi Open, Heiken Ashi Close)
The "better formula" modifies the standard Heiken Ashi calculation by incorporating additional smoothing, which can help reduce noise and make it easier to identify trends and reversals. The modified formulas for Heiken Ashi "better" candles are as follows:
Better Heiken Ashi Close = (Open + High + Low + Close) / 4
Better Heiken Ashi Open = (Previous Better Heiken Ashi Open + Previous Better Heiken Ashi Close) / 2
Better Heiken Ashi High = Max (High, Better Heiken Ashi Open, Better Heiken Ashi Close)
Better Heiken Ashi Low = Min (Low, Better Heiken Ashi Open, Better Heiken Ashi Close)
Smoothing Factor = 2 / (N + 1), where N is the chosen period for smoothing
Smoothed Better Heiken Ashi Open = (Better Heiken Ashi Open * Smoothing Factor) + (Previous Smoothed Better Heiken Ashi Open * (1 - Smoothing Factor))
Smoothed Better Heiken Ashi Close = (Better Heiken Ashi Close * Smoothing Factor) + (Previous Smoothed Better Heiken Ashi Close * (1 - Smoothing Factor))
The smoothed Better Heiken Ashi Open and Close values are then used to calculate the smoothed Better Heiken Ashi High and Low values, resulting in "better" candles that provide a clearer representation of the market trend and potential reversal points.
It's important to note that, like any other technical analysis tool, Heiken Ashi "better" candles are not foolproof and should be used in conjunction with other indicators and analysis techniques to make well-informed trading decisions.
Heiken Ashi "better" candles, as mentioned previously, provide a clearer representation of market trends and potential reversal points by reducing noise and smoothing out price data. When using these candles in conjunction with other technical analysis tools and indicators, traders can gain valuable insights into market behavior and make more informed decisions.
To effectively use Heiken Ashi "better" candles in your trading strategy, consider the following tips:
Trend Identification: Heiken Ashi "better" candles can help you identify the prevailing trend in the market. When the majority of the candles are green (or another color, depending on your chart settings) and there are no or few lower wicks, it may indicate a strong uptrend. Conversely, when the majority of the candles are red (or another color) and there are no or few upper wicks, it may signal a strong downtrend.
Trend Reversals: Look for potential trend reversals when a change in the color of the candles occurs, especially when accompanied by longer wicks. For example, if a green candle with a long lower wick is followed by a red candle, it could indicate a bearish reversal. Similarly, a red candle with a long upper wick followed by a green candle may suggest a bullish reversal.
Support and Resistance: You can use Heiken Ashi "better" candles to identify potential support and resistance levels. When the candles are consistently moving in one direction and then suddenly change color with longer wicks, it could indicate the presence of a support or resistance level.
Stop-Loss and Take-Profit: Using Heiken Ashi "better" candles can help you manage risk by determining optimal stop-loss and take-profit levels. For instance, you can place your stop-loss below the low of the most recent green candle in an uptrend or above the high of the most recent red candle in a downtrend.
Confirming Signals: Heiken Ashi "better" candles should be used in conjunction with other technical indicators, such as moving averages, oscillators, or chart patterns, to confirm signals and improve the accuracy of your analysis.
In this implementation, you have the choice of AMA, KAMA, or T3 smoothing. These are as follows:
Kaufman Adaptive Moving Average (KAMA)
The Kaufman Adaptive Moving Average (KAMA) is a type of adaptive moving average used in technical analysis to smooth out price fluctuations and identify trends. The KAMA adjusts its smoothing factor based on the market's volatility, making it more responsive in volatile markets and smoother in calm markets. The KAMA is calculated using three different efficiency ratios that determine the appropriate smoothing factor for the current market conditions. These ratios are based on the noise level of the market, the speed at which the market is moving, and the length of the moving average. The KAMA is a popular choice among traders who prefer to use adaptive indicators to identify trends and potential reversals.
Adaptive Moving Average
The Adaptive Moving Average (AMA) is a type of moving average that adjusts its sensitivity to price movements based on market conditions. It uses a ratio between the current price and the highest and lowest prices over a certain lookback period to determine its level of smoothing. The AMA can help reduce lag and increase responsiveness to changes in trend direction, making it useful for traders who want to follow trends while avoiding false signals. The AMA is calculated by multiplying a smoothing constant with the difference between the current price and the previous AMA value, then adding the result to the previous AMA value.
T3
The T3 moving average is a type of technical indicator used in financial analysis to identify trends in price movements. It is similar to the Exponential Moving Average (EMA) and the Double Exponential Moving Average (DEMA), but uses a different smoothing algorithm.
The T3 moving average is calculated using a series of exponential moving averages that are designed to filter out noise and smooth the data. The resulting smoothed data is then weighted with a non-linear function to produce a final output that is more responsive to changes in trend direction.
The T3 moving average can be customized by adjusting the length of the moving average, as well as the weighting function used to smooth the data. It is commonly used in conjunction with other technical indicators as part of a larger trading strategy.
█ Giga Kaleidoscope Modularized Trading System
Core components of an NNFX algorithmic trading strategy
The NNFX algorithm is built on the principles of trend, momentum, and volatility. There are six core components in the NNFX trading algorithm:
1. Volatility - price volatility; e.g., Average True Range, True Range Double, Close-to-Close, etc.
2. Baseline - a moving average to identify price trend
3. Confirmation 1 - a technical indicator used to identify trends
4. Confirmation 2 - a technical indicator used to identify trends
5. Continuation - a technical indicator used to identify trends
6. Volatility/Volume - a technical indicator used to identify volatility/volume breakouts/breakdown
7. Exit - a technical indicator used to determine when a trend is exhausted
What is Volatility in the NNFX trading system?
In the NNFX (No Nonsense Forex) trading system, ATR (Average True Range) is typically used to measure the volatility of an asset. It is used as a part of the system to help determine the appropriate stop loss and take profit levels for a trade. ATR is calculated by taking the average of the true range values over a specified period.
True range is calculated as the maximum of the following values:
-Current high minus the current low
-Absolute value of the current high minus the previous close
-Absolute value of the current low minus the previous close
ATR is a dynamic indicator that changes with changes in volatility. As volatility increases, the value of ATR increases, and as volatility decreases, the value of ATR decreases. By using ATR in NNFX system, traders can adjust their stop loss and take profit levels according to the volatility of the asset being traded. This helps to ensure that the trade is given enough room to move, while also minimizing potential losses.
Other types of volatility include True Range Double (TRD), Close-to-Close, and Garman-Klass
What is a Baseline indicator?
The baseline is essentially a moving average, and is used to determine the overall direction of the market.
The baseline in the NNFX system is used to filter out trades that are not in line with the long-term trend of the market. The baseline is plotted on the chart along with other indicators, such as the Moving Average (MA), the Relative Strength Index (RSI), and the Average True Range (ATR).
Trades are only taken when the price is in the same direction as the baseline. For example, if the baseline is sloping upwards, only long trades are taken, and if the baseline is sloping downwards, only short trades are taken. This approach helps to ensure that trades are in line with the overall trend of the market, and reduces the risk of entering trades that are likely to fail.
By using a baseline in the NNFX system, traders can have a clear reference point for determining the overall trend of the market, and can make more informed trading decisions. The baseline helps to filter out noise and false signals, and ensures that trades are taken in the direction of the long-term trend.
What is a Confirmation indicator?
Confirmation indicators are technical indicators that are used to confirm the signals generated by primary indicators. Primary indicators are the core indicators used in the NNFX system, such as the Average True Range (ATR), the Moving Average (MA), and the Relative Strength Index (RSI).
The purpose of the confirmation indicators is to reduce false signals and improve the accuracy of the trading system. They are designed to confirm the signals generated by the primary indicators by providing additional information about the strength and direction of the trend.
Some examples of confirmation indicators that may be used in the NNFX system include the Bollinger Bands, the MACD (Moving Average Convergence Divergence), and the MACD Oscillator. These indicators can provide information about the volatility, momentum, and trend strength of the market, and can be used to confirm the signals generated by the primary indicators.
In the NNFX system, confirmation indicators are used in combination with primary indicators and other filters to create a trading system that is robust and reliable. By using multiple indicators to confirm trading signals, the system aims to reduce the risk of false signals and improve the overall profitability of the trades.
What is a Continuation indicator?
In the NNFX (No Nonsense Forex) trading system, a continuation indicator is a technical indicator that is used to confirm a current trend and predict that the trend is likely to continue in the same direction. A continuation indicator is typically used in conjunction with other indicators in the system, such as a baseline indicator, to provide a comprehensive trading strategy.
What is a Volatility/Volume indicator?
Volume indicators, such as the On Balance Volume (OBV), the Chaikin Money Flow (CMF), or the Volume Price Trend (VPT), are used to measure the amount of buying and selling activity in a market. They are based on the trading volume of the market, and can provide information about the strength of the trend. In the NNFX system, volume indicators are used to confirm trading signals generated by the Moving Average and the Relative Strength Index. Volatility indicators include Average Direction Index, Waddah Attar, and Volatility Ratio. In the NNFX trading system, volatility is a proxy for volume and vice versa.
By using volume indicators as confirmation tools, the NNFX trading system aims to reduce the risk of false signals and improve the overall profitability of trades. These indicators can provide additional information about the market that is not captured by the primary indicators, and can help traders to make more informed trading decisions. In addition, volume indicators can be used to identify potential changes in market trends and to confirm the strength of price movements.
What is an Exit indicator?
The exit indicator is used in conjunction with other indicators in the system, such as the Moving Average (MA), the Relative Strength Index (RSI), and the Average True Range (ATR), to provide a comprehensive trading strategy.
The exit indicator in the NNFX system can be any technical indicator that is deemed effective at identifying optimal exit points. Examples of exit indicators that are commonly used include the Parabolic SAR, the Average Directional Index (ADX), and the Chandelier Exit.
The purpose of the exit indicator is to identify when a trend is likely to reverse or when the market conditions have changed, signaling the need to exit a trade. By using an exit indicator, traders can manage their risk and prevent significant losses.
In the NNFX system, the exit indicator is used in conjunction with a stop loss and a take profit order to maximize profits and minimize losses. The stop loss order is used to limit the amount of loss that can be incurred if the trade goes against the trader, while the take profit order is used to lock in profits when the trade is moving in the trader's favor.
Overall, the use of an exit indicator in the NNFX trading system is an important component of a comprehensive trading strategy. It allows traders to manage their risk effectively and improve the profitability of their trades by exiting at the right time.
How does Loxx's GKD (Giga Kaleidoscope Modularized Trading System) implement the NNFX algorithm outlined above?
Loxx's GKD v1.0 system has five types of modules (indicators/strategies). These modules are:
1. GKD-BT - Backtesting module (Volatility, Number 1 in the NNFX algorithm)
2. GKD-B - Baseline module (Baseline and Volatility/Volume, Numbers 1 and 2 in the NNFX algorithm)
3. GKD-C - Confirmation 1/2 and Continuation module (Confirmation 1/2 and Continuation, Numbers 3, 4, and 5 in the NNFX algorithm)
4. GKD-V - Volatility/Volume module (Confirmation 1/2, Number 6 in the NNFX algorithm)
5. GKD-E - Exit module (Exit, Number 7 in the NNFX algorithm)
(additional module types will added in future releases)
Each module interacts with every module by passing data between modules. Data is passed between each module as described below:
GKD-B => GKD-V => GKD-C(1) => GKD-C(2) => GKD-C(Continuation) => GKD-E => GKD-BT
That is, the Baseline indicator passes its data to Volatility/Volume. The Volatility/Volume indicator passes its values to the Confirmation 1 indicator. The Confirmation 1 indicator passes its values to the Confirmation 2 indicator. The Confirmation 2 indicator passes its values to the Continuation indicator. The Continuation indicator passes its values to the Exit indicator, and finally, the Exit indicator passes its values to the Backtest strategy.
This chaining of indicators requires that each module conform to Loxx's GKD protocol, therefore allowing for the testing of every possible combination of technical indicators that make up the six components of the NNFX algorithm.
What does the application of the GKD trading system look like?
Example trading system:
Backtest: Strategy with 1-3 take profits, trailing stop loss, multiple types of PnL volatility, and 2 backtesting styles
Baseline: Hull Moving Average
Volatility/Volume: Hurst Exponent
Confirmation 1: Sentiment Zone Oscillator as shown on the chart above
Confirmation 2: Williams Percent Range
Continuation: Sentiment Zone Oscillator
Exit: Rex Oscillator
Each GKD indicator is denoted with a module identifier of either: GKD-BT, GKD-B, GKD-C, GKD-V, or GKD-E. This allows traders to understand to which module each indicator belongs and where each indicator fits into the GKD protocol chain.
Giga Kaleidoscope Modularized Trading System Signals (based on the NNFX algorithm)
Standard Entry
1. GKD-C Confirmation 1 Signal
2. GKD-B Baseline agrees
3. Price is within a range of 0.2x Volatility and 1.0x Volatility of the Goldie Locks Mean
4. GKD-C Confirmation 2 agrees
5. GKD-V Volatility/Volume agrees
Baseline Entry
1. GKD-B Baseline signal
2. GKD-C Confirmation 1 agrees
3. Price is within a range of 0.2x Volatility and 1.0x Volatility of the Goldie Locks Mean
4. GKD-C Confirmation 2 agrees
5. GKD-V Volatility/Volume agrees
6. GKD-C Confirmation 1 signal was less than 7 candles prior
Volatility/Volume Entry
1. GKD-V Volatility/Volume signal
2. GKD-C Confirmation 1 agrees
3. Price is within a range of 0.2x Volatility and 1.0x Volatility of the Goldie Locks Mean
4. GKD-C Confirmation 2 agrees
5. GKD-B Baseline agrees
6. GKD-C Confirmation 1 signal was less than 7 candles prior
Continuation Entry
1. Standard Entry, Baseline Entry, or Pullback; entry triggered previously
2. GKD-B Baseline hasn't crossed since entry signal trigger
3. GKD-C Confirmation Continuation Indicator signals
4. GKD-C Confirmation 1 agrees
5. GKD-B Baseline agrees
6. GKD-C Confirmation 2 agrees
1-Candle Rule Standard Entry
1. GKD-C Confirmation 1 signal
2. GKD-B Baseline agrees
3. Price is within a range of 0.2x Volatility and 1.0x Volatility of the Goldie Locks Mean
Next Candle:
1. Price retraced (Long: close < close or Short: close > close )
2. GKD-B Baseline agrees
3. GKD-C Confirmation 1 agrees
4. GKD-C Confirmation 2 agrees
5. GKD-V Volatility/Volume agrees
1-Candle Rule Baseline Entry
1. GKD-B Baseline signal
2. GKD-C Confirmation 1 agrees
3. Price is within a range of 0.2x Volatility and 1.0x Volatility of the Goldie Locks Mean
4. GKD-C Confirmation 1 signal was less than 7 candles prior
Next Candle:
1. Price retraced (Long: close < close or Short: close > close )
2. GKD-B Baseline agrees
3. GKD-C Confirmation 1 agrees
4. GKD-C Confirmation 2 agrees
5. GKD-V Volatility/Volume Agrees
1-Candle Rule Volatility/Volume Entry
1. GKD-V Volatility/Volume signal
2. GKD-C Confirmation 1 agrees
3. Price is within a range of 0.2x Volatility and 1.0x Volatility of the Goldie Locks Mean
4. GKD-C Confirmation 1 signal was less than 7 candles prior
Next Candle:
1. Price retraced (Long: close < close or Short: close > close)
2. GKD-B Volatility/Volume agrees
3. GKD-C Confirmation 1 agrees
4. GKD-C Confirmation 2 agrees
5. GKD-B Baseline agrees
PullBack Entry
1. GKD-B Baseline signal
2. GKD-C Confirmation 1 agrees
3. Price is beyond 1.0x Volatility of Baseline
Next Candle:
1. Price is within a range of 0.2x Volatility and 1.0x Volatility of the Goldie Locks Mean
2. GKD-C Confirmation 1 agrees
3. GKD-C Confirmation 2 agrees
4. GKD-V Volatility/Volume Agrees
]█ Setting up the GKD
The GKD system involves chaining indicators together. These are the steps to set this up.
Use a GKD-C indicator alone on a chart
1. Inside the GKD-C indicator, change the "Confirmation Type" setting to "Solo Confirmation Simple"
Use a GKD-V indicator alone on a chart
**nothing, it's already useable on the chart without any settings changes
Use a GKD-B indicator alone on a chart
**nothing, it's already useable on the chart without any settings changes
Baseline (Baseline, Backtest)
1. Import the GKD-B Baseline into the GKD-BT Backtest: "Input into Volatility/Volume or Backtest (Baseline testing)"
2. Inside the GKD-BT Backtest, change the setting "Backtest Special" to "Baseline"
Volatility/Volume (Volatility/Volume, Backte st)
1. Inside the GKD-V indicator, change the "Testing Type" setting to "Solo"
2. Inside the GKD-V indicator, change the "Signal Type" setting to "Crossing" (neither traditional nor both can be backtested)
3. Import the GKD-V indicator into the GKD-BT Backtest: "Input into C1 or Backtest"
4. Inside the GKD-BT Backtest, change the setting "Backtest Special" to "Volatility/Volume"
5. Inside the GKD-BT Backtest, a) change the setting "Backtest Type" to "Trading" if using a directional GKD-V indicator; or, b) change the setting "Backtest Type" to "Full" if using a directional or non-directional GKD-V indicator (non-directional GKD-V can only test Longs and Shorts separately)
6. If "Backtest Type" is set to "Full": Inside the GKD-BT Backtest, change the setting "Backtest Side" to "Long" or "Short
7. If "Backtest Type" is set to "Full": To allow the system to open multiple orders at one time so you test all Longs or Shorts, open the GKD-BT Backtest, click the tab "Properties" and then insert a value of something like 10 orders into the "Pyramiding" settings. This will allow 10 orders to be opened at one time which should be enough to catch all possible Longs or Shorts.
Solo Confirmation Simple (Confirmation, Backtest)
1. Inside the GKD-C indicator, change the "Confirmation Type" setting to "Solo Confirmation Simple"
1. Import the GKD-C indicator into the GKD-BT Backtest: "Input into Backtest"
2. Inside the GKD-BT Backtest, change the setting "Backtest Special" to "Solo Confirmation Simple"
Solo Confirmation Complex without Exits (Baseline, Volatility/Volume, Confirmation, Backtest)
1. Inside the GKD-V indicator, change the "Testing Type" setting to "Chained"
2. Import the GKD-B Baseline into the GKD-V indicator: "Input into Volatility/Volume or Backtest (Baseline testing)"
3. Inside the GKD-C indicator, change the "Confirmation Type" setting to "Solo Confirmation Complex"
4. Import the GKD-V indicator into the GKD-C indicator: "Input into C1 or Backtest"
5. Inside the GKD-BT Backtest, change the setting "Backtest Special" to "GKD Full wo/ Exits"
6. Import the GKD-C into the GKD-BT Backtest: "Input into Exit or Backtest"
Solo Confirmation Complex with Exits (Baseline, Volatility/Volume, Confirmation, Exit, Backtest)
1. Inside the GKD-V indicator, change the "Testing Type" setting to "Chained"
2. Import the GKD-B Baseline into the GKD-V indicator: "Input into Volatility/Volume or Backtest (Baseline testing)"
3. Inside the GKD-C indicator, change the "Confirmation Type" setting to "Solo Confirmation Complex"
4. Import the GKD-V indicator into the GKD-C indicator: "Input into C1 or Backtest"
5. Import the GKD-C indicator into the GKD-E indicator: "Input into Exit"
6. Inside the GKD-BT Backtest, change the setting "Backtest Special" to "GKD Full w/ Exits"
7. Import the GKD-E into the GKD-BT Backtest: "Input into Backtest"
Full GKD without Exits (Baseline, Volatility/Volume, Confirmation 1, Confirmation 2, Continuation, Backtest)
1. Inside the GKD-V indicator, change the "Testing Type" setting to "Chained"
2. Import the GKD-B Baseline into the GKD-V indicator: "Input into Volatility/Volume or Backtest (Baseline testing)"
3. Inside the GKD-C 1 indicator, change the "Confirmation Type" setting to "Confirmation 1"
4. Import the GKD-V indicator into the GKD-C 1 indicator: "Input into C1 or Backtest"
5. Inside the GKD-C 2 indicator, change the "Confirmation Type" setting to "Confirmation 2"
6. Import the GKD-C 1 indicator into the GKD-C 2 indicator: "Input into C2"
7. Inside the GKD-C Continuation indicator, change the "Confirmation Type" setting to "Continuation"
8. Inside the GKD-BT Backtest, change the setting "Backtest Special" to "GKD Full wo/ Exits"
9. Import the GKD-E into the GKD-BT Backtest: "Input into Exit or Backtest"
Full GKD with Exits (Baseline, Volatility/Volume, Confirmation 1, Confirmation 2, Continuation, Exit, Backtest)
1. Inside the GKD-V indicator, change the "Testing Type" setting to "Chained"
2. Import the GKD-B Baseline into the GKD-V indicator: "Input into Volatility/Volume or Backtest (Baseline testing)"
3. Inside the GKD-C 1 indicator, change the "Confirmation Type" setting to "Confirmation 1"
4. Import the GKD-V indicator into the GKD-C 1 indicator: "Input into C1 or Backtest"
5. Inside the GKD-C 2 indicator, change the "Confirmation Type" setting to "Confirmation 2"
6. Import the GKD-C 1 indicator into the GKD-C 2 indicator: "Input into C2"
7. Inside the GKD-C Continuation indicator, change the "Confirmation Type" setting to "Continuation"
8. Import the GKD-C Continuation indicator into the GKD-E indicator: "Input into Exit"
9. Inside the GKD-BT Backtest, change the setting "Backtest Special" to "GKD Full w/ Exits"
10. Import the GKD-E into the GKD-BT Backtest: "Input into Backtest"
Baseline + Volatility/Volume (Baseline, Volatility/Volume, Backtest)
1. Inside the GKD-V indicator, change the "Testing Type" setting to "Baseline + Volatility/Volume"
2. Inside the GKD-V indicator, make sure the "Signal Type" setting is set to "Traditional"
3. Import the GKD-B Baseline into the GKD-V indicator: "Input into Volatility/Volume or Backtest (Baseline testing)"
4. Inside the GKD-BT Backtest, change the setting "Backtest Special" to "Baseline + Volatility/Volume"
5. Import the GKD-V into the GKD-BT Backtest: "Input into C1 or Backtest"
6. Inside the GKD-BT Backtest, change the setting "Backtest Type" to "Full". For this backtest, you must test Longs and Shorts separately
7. To allow the system to open multiple orders at one time so you can test all Longs or Shorts, open the GKD-BT Backtest, click the tab "Properties" and then insert a value of something like 10 orders into the "Pyramiding" settings. This will allow 10 orders to be opened at one time which should be enough to catch all possible Longs or Shorts.
Requirements
Inputs
Confirmation 1: GKD-V Volatility / Volume indicator
Confirmation 2: GKD-C Confirmation indicator
Continuation: GKD-C Confirmation indicator
Solo Confirmation Simple: GKD-B Baseline
Solo Confirmation Complex: GKD-V Volatility / Volume indicator
Solo Confirmation Super Complex: GKD-V Volatility / Volume indicator
Stacked 1: None
Stacked 2+: GKD-C, GKD-V, or GKD-B Stacked 1
Outputs
Confirmation 1: GKD-C Confirmation 2 indicator
Confirmation 2: GKD-C Continuation indicator
Continuation: GKD-E Exit indicator
Solo Confirmation Simple: GKD-BT Backtest
Solo Confirmation Complex: GKD-BT Backtest or GKD-E Exit indicator
Solo Confirmation Super Complex: GKD-C Continuation indicator
Stacked 1: GKD-C, GKD-V, or GKD-B Stacked 2+
Stacked 2+: GKD-C, GKD-V, or GKD-B Stacked 2+ or GKD-BT Backtest
Additional features will be added in future releases.

GKD-C Vulkan Profit [Loxx]Giga Kaleidoscope GKD-C Vulkan Profit is a Confirmation module included in Loxx's "Giga Kaleidoscope Modularized Trading System".
█ GKD-C Vulkan Profit
What is the Vulkan Profit Indicator?
The Vulkan Profit indicator is a trading tool that helps traders identify potential buy and sell signals in financial markets. It uses a combination of short-term and long-term moving averages to gauge the strength of trends and generate trading signals based on the interaction between these averages. The following explores the workings of the Vulkan Profit indicator, focusing on the concepts and calculations it uses to generate trading signals.
At the core of the Vulkan Profit indicator are two sets of moving averages: the short-term and the long-term. The short-term moving averages are calculated using weighted moving averages (WMA) with periods of 3 and 8. These short-term moving averages, referred to as STL1 and STL2, are designed to track the price movements more closely and respond faster to recent price changes.
The long-term moving averages, on the other hand, are calculated using exponential moving averages (EMA) with periods of 18 and 28. These long-term moving averages, referred to as LTL1 and LTL2, provide a smoother representation of the price movements and are less sensitive to recent price fluctuations. They represent the long-term trend in the market.
The buy and sell signals generated by the Vulkan Profit indicator are based on the relationship between the short-term and long-term moving averages. The indicator monitors the crossover between these two sets of moving averages to identify potential trend reversals.
A buy signal is generated when the minimum value of the short-term moving averages (STL1 and STL2) becomes greater than the maximum value of the long-term moving averages (LTL1 and LTL2), and this condition was not met in the previous candle. This scenario indicates that the short-term trend has shifted upwards, crossing above the long-term trend, and could be a sign of a potential bullish reversal.
Conversely, a sell signal is generated when the maximum value of the short-term moving averages (STL1 and STL2) becomes less than the minimum value of the long-term moving averages (LTL1 and LTL2), and this condition was not met in the previous candle. This indicates that the short-term trend has shifted downwards, crossing below the long-term trend, and could be a sign of a potential bearish reversal.
In summary, the Vulkan Profit indicator is a trading tool that uses a combination of short-term and long-term moving averages to identify potential buy and sell signals in financial markets. By monitoring the crossovers between these two sets of moving averages, the indicator provides traders with an easy-to-understand visual representation of the current trend and potential trend reversals. This information can be valuable for traders looking to time their entries and exits in the market and make more informed trading decisions.
Additional Features
This indicator allows you to select from 33 source types. They are as follows:
Close
Open
High
Low
Median
Typical
Weighted
Average
Average Median Body
Trend Biased
Trend Biased (Extreme)
HA Close
HA Open
HA High
HA Low
HA Median
HA Typical
HA Weighted
HA Average
HA Average Median Body
HA Trend Biased
HA Trend Biased (Extreme)
HAB Close
HAB Open
HAB High
HAB Low
HAB Median
HAB Typical
HAB Weighted
HAB Average
HAB Average Median Body
HAB Trend Biased
HAB Trend Biased (Extreme)
What are Heiken Ashi "better" candles?
Heiken Ashi "better" candles are a modified version of the standard Heiken Ashi candles, which are a popular charting technique used in technical analysis. Heiken Ashi candles help traders identify trends and potential reversal points by smoothing out price data and reducing market noise. The "better formula" was proposed by Sebastian Schmidt in an article published by BNP Paribas in Warrants & Zertifikate, a German magazine, in August 2004. The aim of this formula is to further improve the smoothing of the Heiken Ashi chart and enhance its effectiveness in identifying trends and reversals.
Standard Heiken Ashi candles are calculated using the following formulas:
Heiken Ashi Close = (Open + High + Low + Close) / 4
Heiken Ashi Open = (Previous Heiken Ashi Open + Previous Heiken Ashi Close) / 2
Heiken Ashi High = Max (High, Heiken Ashi Open, Heiken Ashi Close)
Heiken Ashi Low = Min (Low, Heiken Ashi Open, Heiken Ashi Close)
The "better formula" modifies the standard Heiken Ashi calculation by incorporating additional smoothing, which can help reduce noise and make it easier to identify trends and reversals. The modified formulas for Heiken Ashi "better" candles are as follows:
Better Heiken Ashi Close = (Open + High + Low + Close) / 4
Better Heiken Ashi Open = (Previous Better Heiken Ashi Open + Previous Better Heiken Ashi Close) / 2
Better Heiken Ashi High = Max (High, Better Heiken Ashi Open, Better Heiken Ashi Close)
Better Heiken Ashi Low = Min (Low, Better Heiken Ashi Open, Better Heiken Ashi Close)
Smoothing Factor = 2 / (N + 1), where N is the chosen period for smoothing
Smoothed Better Heiken Ashi Open = (Better Heiken Ashi Open * Smoothing Factor) + (Previous Smoothed Better Heiken Ashi Open * (1 - Smoothing Factor))
Smoothed Better Heiken Ashi Close = (Better Heiken Ashi Close * Smoothing Factor) + (Previous Smoothed Better Heiken Ashi Close * (1 - Smoothing Factor))
The smoothed Better Heiken Ashi Open and Close values are then used to calculate the smoothed Better Heiken Ashi High and Low values, resulting in "better" candles that provide a clearer representation of the market trend and potential reversal points.
It's important to note that, like any other technical analysis tool, Heiken Ashi "better" candles are not foolproof and should be used in conjunction with other indicators and analysis techniques to make well-informed trading decisions.
Heiken Ashi "better" candles, as mentioned previously, provide a clearer representation of market trends and potential reversal points by reducing noise and smoothing out price data. When using these candles in conjunction with other technical analysis tools and indicators, traders can gain valuable insights into market behavior and make more informed decisions.
To effectively use Heiken Ashi "better" candles in your trading strategy, consider the following tips:
Trend Identification: Heiken Ashi "better" candles can help you identify the prevailing trend in the market. When the majority of the candles are green (or another color, depending on your chart settings) and there are no or few lower wicks, it may indicate a strong uptrend. Conversely, when the majority of the candles are red (or another color) and there are no or few upper wicks, it may signal a strong downtrend.
Trend Reversals: Look for potential trend reversals when a change in the color of the candles occurs, especially when accompanied by longer wicks. For example, if a green candle with a long lower wick is followed by a red candle, it could indicate a bearish reversal. Similarly, a red candle with a long upper wick followed by a green candle may suggest a bullish reversal.
Support and Resistance: You can use Heiken Ashi "better" candles to identify potential support and resistance levels. When the candles are consistently moving in one direction and then suddenly change color with longer wicks, it could indicate the presence of a support or resistance level.
Stop-Loss and Take-Profit: Using Heiken Ashi "better" candles can help you manage risk by determining optimal stop-loss and take-profit levels. For instance, you can place your stop-loss below the low of the most recent green candle in an uptrend or above the high of the most recent red candle in a downtrend.
Confirming Signals: Heiken Ashi "better" candles should be used in conjunction with other technical indicators, such as moving averages, oscillators, or chart patterns, to confirm signals and improve the accuracy of your analysis.
In this implementation, you have the choice of AMA, KAMA, or T3 smoothing. These are as follows:
Kaufman Adaptive Moving Average (KAMA)
The Kaufman Adaptive Moving Average (KAMA) is a type of adaptive moving average used in technical analysis to smooth out price fluctuations and identify trends. The KAMA adjusts its smoothing factor based on the market's volatility, making it more responsive in volatile markets and smoother in calm markets. The KAMA is calculated using three different efficiency ratios that determine the appropriate smoothing factor for the current market conditions. These ratios are based on the noise level of the market, the speed at which the market is moving, and the length of the moving average. The KAMA is a popular choice among traders who prefer to use adaptive indicators to identify trends and potential reversals.
Adaptive Moving Average
The Adaptive Moving Average (AMA) is a type of moving average that adjusts its sensitivity to price movements based on market conditions. It uses a ratio between the current price and the highest and lowest prices over a certain lookback period to determine its level of smoothing. The AMA can help reduce lag and increase responsiveness to changes in trend direction, making it useful for traders who want to follow trends while avoiding false signals. The AMA is calculated by multiplying a smoothing constant with the difference between the current price and the previous AMA value, then adding the result to the previous AMA value.
T3
The T3 moving average is a type of technical indicator used in financial analysis to identify trends in price movements. It is similar to the Exponential Moving Average (EMA) and the Double Exponential Moving Average (DEMA), but uses a different smoothing algorithm.
The T3 moving average is calculated using a series of exponential moving averages that are designed to filter out noise and smooth the data. The resulting smoothed data is then weighted with a non-linear function to produce a final output that is more responsive to changes in trend direction.
The T3 moving average can be customized by adjusting the length of the moving average, as well as the weighting function used to smooth the data. It is commonly used in conjunction with other technical indicators as part of a larger trading strategy.
█ Giga Kaleidoscope Modularized Trading System
Core components of an NNFX algorithmic trading strategy
The NNFX algorithm is built on the principles of trend, momentum, and volatility. There are six core components in the NNFX trading algorithm:
1. Volatility - price volatility; e.g., Average True Range, True Range Double, Close-to-Close, etc.
2. Baseline - a moving average to identify price trend
3. Confirmation 1 - a technical indicator used to identify trends
4. Confirmation 2 - a technical indicator used to identify trends
5. Continuation - a technical indicator used to identify trends
6. Volatility/Volume - a technical indicator used to identify volatility/volume breakouts/breakdown
7. Exit - a technical indicator used to determine when a trend is exhausted
What is Volatility in the NNFX trading system?
In the NNFX (No Nonsense Forex) trading system, ATR (Average True Range) is typically used to measure the volatility of an asset. It is used as a part of the system to help determine the appropriate stop loss and take profit levels for a trade. ATR is calculated by taking the average of the true range values over a specified period.
True range is calculated as the maximum of the following values:
-Current high minus the current low
-Absolute value of the current high minus the previous close
-Absolute value of the current low minus the previous close
ATR is a dynamic indicator that changes with changes in volatility. As volatility increases, the value of ATR increases, and as volatility decreases, the value of ATR decreases. By using ATR in NNFX system, traders can adjust their stop loss and take profit levels according to the volatility of the asset being traded. This helps to ensure that the trade is given enough room to move, while also minimizing potential losses.
Other types of volatility include True Range Double (TRD), Close-to-Close, and Garman-Klass
What is a Baseline indicator?
The baseline is essentially a moving average, and is used to determine the overall direction of the market.
The baseline in the NNFX system is used to filter out trades that are not in line with the long-term trend of the market. The baseline is plotted on the chart along with other indicators, such as the Moving Average (MA), the Relative Strength Index (RSI), and the Average True Range (ATR).
Trades are only taken when the price is in the same direction as the baseline. For example, if the baseline is sloping upwards, only long trades are taken, and if the baseline is sloping downwards, only short trades are taken. This approach helps to ensure that trades are in line with the overall trend of the market, and reduces the risk of entering trades that are likely to fail.
By using a baseline in the NNFX system, traders can have a clear reference point for determining the overall trend of the market, and can make more informed trading decisions. The baseline helps to filter out noise and false signals, and ensures that trades are taken in the direction of the long-term trend.
What is a Confirmation indicator?
Confirmation indicators are technical indicators that are used to confirm the signals generated by primary indicators. Primary indicators are the core indicators used in the NNFX system, such as the Average True Range (ATR), the Moving Average (MA), and the Relative Strength Index (RSI).
The purpose of the confirmation indicators is to reduce false signals and improve the accuracy of the trading system. They are designed to confirm the signals generated by the primary indicators by providing additional information about the strength and direction of the trend.
Some examples of confirmation indicators that may be used in the NNFX system include the Bollinger Bands, the MACD (Moving Average Convergence Divergence), and the MACD Oscillator. These indicators can provide information about the volatility, momentum, and trend strength of the market, and can be used to confirm the signals generated by the primary indicators.
In the NNFX system, confirmation indicators are used in combination with primary indicators and other filters to create a trading system that is robust and reliable. By using multiple indicators to confirm trading signals, the system aims to reduce the risk of false signals and improve the overall profitability of the trades.
What is a Continuation indicator?
In the NNFX (No Nonsense Forex) trading system, a continuation indicator is a technical indicator that is used to confirm a current trend and predict that the trend is likely to continue in the same direction. A continuation indicator is typically used in conjunction with other indicators in the system, such as a baseline indicator, to provide a comprehensive trading strategy.
What is a Volatility/Volume indicator?
Volume indicators, such as the On Balance Volume (OBV), the Chaikin Money Flow (CMF), or the Volume Price Trend (VPT), are used to measure the amount of buying and selling activity in a market. They are based on the trading volume of the market, and can provide information about the strength of the trend. In the NNFX system, volume indicators are used to confirm trading signals generated by the Moving Average and the Relative Strength Index. Volatility indicators include Average Direction Index, Waddah Attar, and Volatility Ratio. In the NNFX trading system, volatility is a proxy for volume and vice versa.
By using volume indicators as confirmation tools, the NNFX trading system aims to reduce the risk of false signals and improve the overall profitability of trades. These indicators can provide additional information about the market that is not captured by the primary indicators, and can help traders to make more informed trading decisions. In addition, volume indicators can be used to identify potential changes in market trends and to confirm the strength of price movements.
What is an Exit indicator?
The exit indicator is used in conjunction with other indicators in the system, such as the Moving Average (MA), the Relative Strength Index (RSI), and the Average True Range (ATR), to provide a comprehensive trading strategy.
The exit indicator in the NNFX system can be any technical indicator that is deemed effective at identifying optimal exit points. Examples of exit indicators that are commonly used include the Parabolic SAR, the Average Directional Index (ADX), and the Chandelier Exit.
The purpose of the exit indicator is to identify when a trend is likely to reverse or when the market conditions have changed, signaling the need to exit a trade. By using an exit indicator, traders can manage their risk and prevent significant losses.
In the NNFX system, the exit indicator is used in conjunction with a stop loss and a take profit order to maximize profits and minimize losses. The stop loss order is used to limit the amount of loss that can be incurred if the trade goes against the trader, while the take profit order is used to lock in profits when the trade is moving in the trader's favor.
Overall, the use of an exit indicator in the NNFX trading system is an important component of a comprehensive trading strategy. It allows traders to manage their risk effectively and improve the profitability of their trades by exiting at the right time.
How does Loxx's GKD (Giga Kaleidoscope Modularized Trading System) implement the NNFX algorithm outlined above?
Loxx's GKD v1.0 system has five types of modules (indicators/strategies). These modules are:
1. GKD-BT - Backtesting module (Volatility, Number 1 in the NNFX algorithm)
2. GKD-B - Baseline module (Baseline and Volatility/Volume, Numbers 1 and 2 in the NNFX algorithm)
3. GKD-C - Confirmation 1/2 and Continuation module (Confirmation 1/2 and Continuation, Numbers 3, 4, and 5 in the NNFX algorithm)
4. GKD-V - Volatility/Volume module (Confirmation 1/2, Number 6 in the NNFX algorithm)
5. GKD-E - Exit module (Exit, Number 7 in the NNFX algorithm)
(additional module types will added in future releases)
Each module interacts with every module by passing data between modules. Data is passed between each module as described below:
GKD-B => GKD-V => GKD-C(1) => GKD-C(2) => GKD-C(Continuation) => GKD-E => GKD-BT
That is, the Baseline indicator passes its data to Volatility/Volume. The Volatility/Volume indicator passes its values to the Confirmation 1 indicator. The Confirmation 1 indicator passes its values to the Confirmation 2 indicator. The Confirmation 2 indicator passes its values to the Continuation indicator. The Continuation indicator passes its values to the Exit indicator, and finally, the Exit indicator passes its values to the Backtest strategy.
This chaining of indicators requires that each module conform to Loxx's GKD protocol, therefore allowing for the testing of every possible combination of technical indicators that make up the six components of the NNFX algorithm.
What does the application of the GKD trading system look like?
Example trading system:
Backtest: Strategy with 1-3 take profits, trailing stop loss, multiple types of PnL volatility, and 2 backtesting styles
Baseline: Hull Moving Average
Volatility/Volume: Hurst Exponent
Confirmation 1: Vulkan Profit as shown on the chart above
Confirmation 2: Williams Percent Range
Continuation: Vulkan Profit
Exit: Rex Oscillator
Each GKD indicator is denoted with a module identifier of either: GKD-BT, GKD-B, GKD-C, GKD-V, or GKD-E. This allows traders to understand to which module each indicator belongs and where each indicator fits into the GKD protocol chain.
Giga Kaleidoscope Modularized Trading System Signals (based on the NNFX algorithm)
Standard Entry
1. GKD-C Confirmation 1 Signal
2. GKD-B Baseline agrees
3. Price is within a range of 0.2x Volatility and 1.0x Volatility of the Goldie Locks Mean
4. GKD-C Confirmation 2 agrees
5. GKD-V Volatility/Volume agrees
Baseline Entry
1. GKD-B Baseline signal
2. GKD-C Confirmation 1 agrees
3. Price is within a range of 0.2x Volatility and 1.0x Volatility of the Goldie Locks Mean
4. GKD-C Confirmation 2 agrees
5. GKD-V Volatility/Volume agrees
6. GKD-C Confirmation 1 signal was less than 7 candles prior
Volatility/Volume Entry
1. GKD-V Volatility/Volume signal
2. GKD-C Confirmation 1 agrees
3. Price is within a range of 0.2x Volatility and 1.0x Volatility of the Goldie Locks Mean
4. GKD-C Confirmation 2 agrees
5. GKD-B Baseline agrees
6. GKD-C Confirmation 1 signal was less than 7 candles prior
Continuation Entry
1. Standard Entry, Baseline Entry, or Pullback; entry triggered previously
2. GKD-B Baseline hasn't crossed since entry signal trigger
3. GKD-C Confirmation Continuation Indicator signals
4. GKD-C Confirmation 1 agrees
5. GKD-B Baseline agrees
6. GKD-C Confirmation 2 agrees
1-Candle Rule Standard Entry
1. GKD-C Confirmation 1 signal
2. GKD-B Baseline agrees
3. Price is within a range of 0.2x Volatility and 1.0x Volatility of the Goldie Locks Mean
Next Candle:
1. Price retraced (Long: close < close or Short: close > close )
2. GKD-B Baseline agrees
3. GKD-C Confirmation 1 agrees
4. GKD-C Confirmation 2 agrees
5. GKD-V Volatility/Volume agrees
1-Candle Rule Baseline Entry
1. GKD-B Baseline signal
2. GKD-C Confirmation 1 agrees
3. Price is within a range of 0.2x Volatility and 1.0x Volatility of the Goldie Locks Mean
4. GKD-C Confirmation 1 signal was less than 7 candles prior
Next Candle:
1. Price retraced (Long: close < close or Short: close > close )
2. GKD-B Baseline agrees
3. GKD-C Confirmation 1 agrees
4. GKD-C Confirmation 2 agrees
5. GKD-V Volatility/Volume Agrees
1-Candle Rule Volatility/Volume Entry
1. GKD-V Volatility/Volume signal
2. GKD-C Confirmation 1 agrees
3. Price is within a range of 0.2x Volatility and 1.0x Volatility of the Goldie Locks Mean
4. GKD-C Confirmation 1 signal was less than 7 candles prior
Next Candle:
1. Price retraced (Long: close < close or Short: close > close)
2. GKD-B Volatility/Volume agrees
3. GKD-C Confirmation 1 agrees
4. GKD-C Confirmation 2 agrees
5. GKD-B Baseline agrees
PullBack Entry
1. GKD-B Baseline signal
2. GKD-C Confirmation 1 agrees
3. Price is beyond 1.0x Volatility of Baseline
Next Candle:
1. Price is within a range of 0.2x Volatility and 1.0x Volatility of the Goldie Locks Mean
2. GKD-C Confirmation 1 agrees
3. GKD-C Confirmation 2 agrees
4. GKD-V Volatility/Volume Agrees
]█ Setting up the GKD
The GKD system involves chaining indicators together. These are the steps to set this up.
Use a GKD-C indicator alone on a chart
1. Inside the GKD-C indicator, change the "Confirmation Type" setting to "Solo Confirmation Simple"
Use a GKD-V indicator alone on a chart
**nothing, it's already useable on the chart without any settings changes
Use a GKD-B indicator alone on a chart
**nothing, it's already useable on the chart without any settings changes
Baseline (Baseline, Backtest)
1. Import the GKD-B Baseline into the GKD-BT Backtest: "Input into Volatility/Volume or Backtest (Baseline testing)"
2. Inside the GKD-BT Backtest, change the setting "Backtest Special" to "Baseline"
Volatility/Volume (Volatility/Volume, Backte st)
1. Inside the GKD-V indicator, change the "Testing Type" setting to "Solo"
2. Inside the GKD-V indicator, change the "Signal Type" setting to "Crossing" (neither traditional nor both can be backtested)
3. Import the GKD-V indicator into the GKD-BT Backtest: "Input into C1 or Backtest"
4. Inside the GKD-BT Backtest, change the setting "Backtest Special" to "Volatility/Volume"
5. Inside the GKD-BT Backtest, a) change the setting "Backtest Type" to "Trading" if using a directional GKD-V indicator; or, b) change the setting "Backtest Type" to "Full" if using a directional or non-directional GKD-V indicator (non-directional GKD-V can only test Longs and Shorts separately)
6. If "Backtest Type" is set to "Full": Inside the GKD-BT Backtest, change the setting "Backtest Side" to "Long" or "Short
7. If "Backtest Type" is set to "Full": To allow the system to open multiple orders at one time so you test all Longs or Shorts, open the GKD-BT Backtest, click the tab "Properties" and then insert a value of something like 10 orders into the "Pyramiding" settings. This will allow 10 orders to be opened at one time which should be enough to catch all possible Longs or Shorts.
Solo Confirmation Simple (Confirmation, Backtest)
1. Inside the GKD-C indicator, change the "Confirmation Type" setting to "Solo Confirmation Simple"
1. Import the GKD-C indicator into the GKD-BT Backtest: "Input into Backtest"
2. Inside the GKD-BT Backtest, change the setting "Backtest Special" to "Solo Confirmation Simple"
Solo Confirmation Complex without Exits (Baseline, Volatility/Volume, Confirmation, Backtest)
1. Inside the GKD-V indicator, change the "Testing Type" setting to "Chained"
2. Import the GKD-B Baseline into the GKD-V indicator: "Input into Volatility/Volume or Backtest (Baseline testing)"
3. Inside the GKD-C indicator, change the "Confirmation Type" setting to "Solo Confirmation Complex"
4. Import the GKD-V indicator into the GKD-C indicator: "Input into C1 or Backtest"
5. Inside the GKD-BT Backtest, change the setting "Backtest Special" to "GKD Full wo/ Exits"
6. Import the GKD-C into the GKD-BT Backtest: "Input into Exit or Backtest"
Solo Confirmation Complex with Exits (Baseline, Volatility/Volume, Confirmation, Exit, Backtest)
1. Inside the GKD-V indicator, change the "Testing Type" setting to "Chained"
2. Import the GKD-B Baseline into the GKD-V indicator: "Input into Volatility/Volume or Backtest (Baseline testing)"
3. Inside the GKD-C indicator, change the "Confirmation Type" setting to "Solo Confirmation Complex"
4. Import the GKD-V indicator into the GKD-C indicator: "Input into C1 or Backtest"
5. Import the GKD-C indicator into the GKD-E indicator: "Input into Exit"
6. Inside the GKD-BT Backtest, change the setting "Backtest Special" to "GKD Full w/ Exits"
7. Import the GKD-E into the GKD-BT Backtest: "Input into Backtest"
Full GKD without Exits (Baseline, Volatility/Volume, Confirmation 1, Confirmation 2, Continuation, Backtest)
1. Inside the GKD-V indicator, change the "Testing Type" setting to "Chained"
2. Import the GKD-B Baseline into the GKD-V indicator: "Input into Volatility/Volume or Backtest (Baseline testing)"
3. Inside the GKD-C 1 indicator, change the "Confirmation Type" setting to "Confirmation 1"
4. Import the GKD-V indicator into the GKD-C 1 indicator: "Input into C1 or Backtest"
5. Inside the GKD-C 2 indicator, change the "Confirmation Type" setting to "Confirmation 2"
6. Import the GKD-C 1 indicator into the GKD-C 2 indicator: "Input into C2"
7. Inside the GKD-C Continuation indicator, change the "Confirmation Type" setting to "Continuation"
8. Inside the GKD-BT Backtest, change the setting "Backtest Special" to "GKD Full wo/ Exits"
9. Import the GKD-E into the GKD-BT Backtest: "Input into Exit or Backtest"
Full GKD with Exits (Baseline, Volatility/Volume, Confirmation 1, Confirmation 2, Continuation, Exit, Backtest)
1. Inside the GKD-V indicator, change the "Testing Type" setting to "Chained"
2. Import the GKD-B Baseline into the GKD-V indicator: "Input into Volatility/Volume or Backtest (Baseline testing)"
3. Inside the GKD-C 1 indicator, change the "Confirmation Type" setting to "Confirmation 1"
4. Import the GKD-V indicator into the GKD-C 1 indicator: "Input into C1 or Backtest"
5. Inside the GKD-C 2 indicator, change the "Confirmation Type" setting to "Confirmation 2"
6. Import the GKD-C 1 indicator into the GKD-C 2 indicator: "Input into C2"
7. Inside the GKD-C Continuation indicator, change the "Confirmation Type" setting to "Continuation"
8. Import the GKD-C Continuation indicator into the GKD-E indicator: "Input into Exit"
9. Inside the GKD-BT Backtest, change the setting "Backtest Special" to "GKD Full w/ Exits"
10. Import the GKD-E into the GKD-BT Backtest: "Input into Backtest"
Baseline + Volatility/Volume (Baseline, Volatility/Volume, Backtest)
1. Inside the GKD-V indicator, change the "Testing Type" setting to "Baseline + Volatility/Volume"
2. Inside the GKD-V indicator, make sure the "Signal Type" setting is set to "Traditional"
3. Import the GKD-B Baseline into the GKD-V indicator: "Input into Volatility/Volume or Backtest (Baseline testing)"
4. Inside the GKD-BT Backtest, change the setting "Backtest Special" to "Baseline + Volatility/Volume"
5. Import the GKD-V into the GKD-BT Backtest: "Input into C1 or Backtest"
6. Inside the GKD-BT Backtest, change the setting "Backtest Type" to "Full". For this backtest, you must test Longs and Shorts separately
7. To allow the system to open multiple orders at one time so you can test all Longs or Shorts, open the GKD-BT Backtest, click the tab "Properties" and then insert a value of something like 10 orders into the "Pyramiding" settings. This will allow 10 orders to be opened at one time which should be enough to catch all possible Longs or Shorts.
Requirements
Inputs
Confirmation 1: GKD-V Volatility / Volume indicator
Confirmation 2: GKD-C Confirmation indicator
Continuation: GKD-C Confirmation indicator
Solo Confirmation Simple: GKD-B Baseline
Solo Confirmation Complex: GKD-V Volatility / Volume indicator
Solo Confirmation Super Complex: GKD-V Volatility / Volume indicator
Stacked 1: None
Stacked 2+: GKD-C, GKD-V, or GKD-B Stacked 1
Outputs
Confirmation 1: GKD-C Confirmation 2 indicator
Confirmation 2: GKD-C Continuation indicator
Continuation: GKD-E Exit indicator
Solo Confirmation Simple: GKD-BT Backtest
Solo Confirmation Complex: GKD-BT Backtest or GKD-E Exit indicator
Solo Confirmation Super Complex: GKD-C Continuation indicator
Stacked 1: GKD-C, GKD-V, or GKD-B Stacked 2+
Stacked 2+: GKD-C, GKD-V, or GKD-B Stacked 2+ or GKD-BT Backtest
Additional features will be added in future releases.

GKD-C Polychromatic Momentum [Loxx]Giga Kaleidoscope GKD-C Polychromatic Momentum is a Confirmation module included in Loxx's "Giga Kaleidoscope Modularized Trading System".
█ GKD-C Polychromatic Momentum
Polychromatic Momentum: A Refined Approach to Momentum Calculation in Technical Analysis
In the world of finance and trading, technical analysis plays a crucial role in understanding price movements and making informed decisions. One popular method in technical analysis is calculating momentum, which indicates the strength of a trend by analyzing the rate of change in prices. The following explains a specific implementation of momentum calculation known as Polychromatic Momentum, highlighting its features and potential advantages over traditional momentum calculations.
Polychromatic Momentum Calculation
Polychromatic Momentum enhances the traditional momentum calculation by employing a weighted approach to momentum values. This method begins by initializing two variables to store the cumulative momentum values and their respective weights throughout the calculation process.
The calculation iterates through the range of the price data. For each iteration, a weight is calculated as the square root of the index plus one. The weight serves as a scaling factor, emphasizing more recent price changes over older ones. This allows the Polychromatic Momentum to account for the significance of recent trends in the market.
Next, the momentum value for the current index is calculated by finding the difference between the current source price and the source price at the previous index. This difference is then divided by the calculated weight. The momentum value is added to the cumulative sum, and the weight is added to the sum of weights.
Once the iteration is complete, the Polychromatic Momentum is obtained by dividing the cumulative sum of momentum values by the sum of weights. This calculation method provides a more nuanced understanding of the momentum by taking into account the varying importance of price changes over time.
Polychromatic Momentum offers a different approach to momentum calculation compared to regular momentum. While both methods aim to measure the strength of a trend by analyzing the rate of change in prices, their calculations differ in certain aspects, which may result in advantages for Polychromatic Momentum.
Regular momentum is calculated by subtracting the price value at a specific period in the past from the current price value. This method provides a simple and straightforward way to determine the price change over a fixed period.
Polychromatic Momentum, on the other hand, employs a weighted approach to momentum values. It calculates the momentum by considering a range of price changes over time and assigning weights to each change based on their recency. This approach aims to capture the varying importance of price changes over time, which can be beneficial in certain market conditions.
Some potential advantages of Polychromatic Momentum over regular momentum include:
1. Responsiveness: Polychromatic Momentum places greater emphasis on recent price changes, making it more responsive to new trends in the market. This responsiveness could provide timely signals for traders to capitalize on emerging trends.
2. Enhanced Trend Analysis: By considering a range of price changes over time and assigning weights to each change, Polychromatic Momentum can provide a more comprehensive analysis of the market trends. This can help traders better understand the overall momentum and make more informed decisions.
3. Flexibility: Polychromatic Momentum's weighted approach allows for greater flexibility in adapting to different market conditions and timeframes. Traders can experiment with different weighting schemes to optimize the momentum calculation for their specific trading strategies and goals.
In conclusion, Polychromatic Momentum offers a more refined approach to momentum calculation in technical analysis compared to traditional methods. By using a weighted approach, it effectively takes into account the varying importance of price changes over time, providing traders with a more insightful and responsive measure of market trends.
What is Double Smoothed Exponential Moving Average?
In financial markets and trading, technical analysis serves as a critical tool for evaluating price trends and making strategic decisions. A key component of technical analysis is the moving average, which averages price data over a specified period to smooth out fluctuations and identify market trends. While the Exponential Moving Average (EMA) is a popular moving average variant that emphasizes recent data points, the Double Smoothed Exponential Moving Average (DSEMA) takes it a step further by incorporating two layers of EMA calculations for more advanced smoothing. The following delve into the DSEMA methodology, explaining its working mechanism and the logic behind the technique without referring to specific code variables.
Double Smoothed Exponential Moving Average Explanation
DSEMA is a function that processes source price data and the length of the smoothing period as its inputs. Its primary objective is to minimize noise in the price data and generate a smoother output, which can be advantageous for detecting trends and making informed trading decisions.
The DSEMA calculation begins by determining the alpha value, which is the smoothing factor for the EMA. The alpha value is derived from the square root of the length of the smoothing period, ensuring that it falls between 0 and 1. A higher alpha value leads to a more responsive EMA, while a lower alpha value results in a slower-moving EMA that is less affected by recent price fluctuations.
The core of the DSEMA calculation involves applying two layers of EMA. The first layer calculates the initial EMA using the source price data and the alpha value. This first EMA places more weight on recent price data points, similar to a regular EMA.
The second layer calculates another EMA using the initial EMA values and the same alpha value. This second layer of EMA provides additional smoothing to the price data, resulting in a smoother output curve that is less prone to noise and sudden market changes. The final output of the DSEMA is the result of the second EMA layer.
In summary, the Double Smoothed Exponential Moving Average (DSEMA) offers an advanced approach to price data smoothing in technical analysis by applying two successive layers of EMA calculations. This technique enhances the detection of market trends and helps reduce the impact of noise in price data, providing traders with a more reliable representation of price movements to support their decision-making process.
Combining DSEMA and Polychromatic Momentum
DSEMA is an advanced smoothing technique that applies two layers of Exponential Moving Average (EMA) calculations to reduce noise in price data and produce a smoother representation of the market trends. On the other hand, Polychromatic Momentum is a momentum calculation method that employs a weighted approach to assess the strength of trends by analyzing the rate of change in prices over time.
By combining the two techniques, DSEMA can be used to smooth the source price data before inputting it into the Polychromatic Momentum calculation. This combination allows for a more accurate representation of price movements, as the smoothed price data provided by DSEMA minimizes the impact of sudden market fluctuations and noise on the momentum calculation.
The result is an enhanced technical analysis tool that leverages the benefits of advanced price smoothing from DSEMA and the refined trend assessment of Polychromatic Momentum. This integrated approach can help traders gain a deeper understanding of market dynamics and make more informed decisions based on reliable, noise-reduced price data and nuanced momentum calculations.
For our purposes here, only the source price can be smoothed and it's turned off by default. The smoothing period is zero by default. Any period above 0 and the smoothing will kick in. Try a period of 5.
Additional Features
This indicator allows you to select from 33 source types. They are as follows:
Close
Open
High
Low
Median
Typical
Weighted
Average
Average Median Body
Trend Biased
Trend Biased (Extreme)
HA Close
HA Open
HA High
HA Low
HA Median
HA Typical
HA Weighted
HA Average
HA Average Median Body
HA Trend Biased
HA Trend Biased (Extreme)
HAB Close
HAB Open
HAB High
HAB Low
HAB Median
HAB Typical
HAB Weighted
HAB Average
HAB Average Median Body
HAB Trend Biased
HAB Trend Biased (Extreme)
What are Heiken Ashi "better" candles?
Heiken Ashi "better" candles are a modified version of the standard Heiken Ashi candles, which are a popular charting technique used in technical analysis. Heiken Ashi candles help traders identify trends and potential reversal points by smoothing out price data and reducing market noise. The "better formula" was proposed by Sebastian Schmidt in an article published by BNP Paribas in Warrants & Zertifikate, a German magazine, in August 2004. The aim of this formula is to further improve the smoothing of the Heiken Ashi chart and enhance its effectiveness in identifying trends and reversals.
Standard Heiken Ashi candles are calculated using the following formulas:
Heiken Ashi Close = (Open + High + Low + Close) / 4
Heiken Ashi Open = (Previous Heiken Ashi Open + Previous Heiken Ashi Close) / 2
Heiken Ashi High = Max (High, Heiken Ashi Open, Heiken Ashi Close)
Heiken Ashi Low = Min (Low, Heiken Ashi Open, Heiken Ashi Close)
The "better formula" modifies the standard Heiken Ashi calculation by incorporating additional smoothing, which can help reduce noise and make it easier to identify trends and reversals. The modified formulas for Heiken Ashi "better" candles are as follows:
Better Heiken Ashi Close = (Open + High + Low + Close) / 4
Better Heiken Ashi Open = (Previous Better Heiken Ashi Open + Previous Better Heiken Ashi Close) / 2
Better Heiken Ashi High = Max (High, Better Heiken Ashi Open, Better Heiken Ashi Close)
Better Heiken Ashi Low = Min (Low, Better Heiken Ashi Open, Better Heiken Ashi Close)
Smoothing Factor = 2 / (N + 1), where N is the chosen period for smoothing
Smoothed Better Heiken Ashi Open = (Better Heiken Ashi Open * Smoothing Factor) + (Previous Smoothed Better Heiken Ashi Open * (1 - Smoothing Factor))
Smoothed Better Heiken Ashi Close = (Better Heiken Ashi Close * Smoothing Factor) + (Previous Smoothed Better Heiken Ashi Close * (1 - Smoothing Factor))
The smoothed Better Heiken Ashi Open and Close values are then used to calculate the smoothed Better Heiken Ashi High and Low values, resulting in "better" candles that provide a clearer representation of the market trend and potential reversal points.
It's important to note that, like any other technical analysis tool, Heiken Ashi "better" candles are not foolproof and should be used in conjunction with other indicators and analysis techniques to make well-informed trading decisions.
Heiken Ashi "better" candles, as mentioned previously, provide a clearer representation of market trends and potential reversal points by reducing noise and smoothing out price data. When using these candles in conjunction with other technical analysis tools and indicators, traders can gain valuable insights into market behavior and make more informed decisions.
To effectively use Heiken Ashi "better" candles in your trading strategy, consider the following tips:
Trend Identification: Heiken Ashi "better" candles can help you identify the prevailing trend in the market. When the majority of the candles are green (or another color, depending on your chart settings) and there are no or few lower wicks, it may indicate a strong uptrend. Conversely, when the majority of the candles are red (or another color) and there are no or few upper wicks, it may signal a strong downtrend.
Trend Reversals: Look for potential trend reversals when a change in the color of the candles occurs, especially when accompanied by longer wicks. For example, if a green candle with a long lower wick is followed by a red candle, it could indicate a bearish reversal. Similarly, a red candle with a long upper wick followed by a green candle may suggest a bullish reversal.
Support and Resistance: You can use Heiken Ashi "better" candles to identify potential support and resistance levels. When the candles are consistently moving in one direction and then suddenly change color with longer wicks, it could indicate the presence of a support or resistance level.
Stop-Loss and Take-Profit: Using Heiken Ashi "better" candles can help you manage risk by determining optimal stop-loss and take-profit levels. For instance, you can place your stop-loss below the low of the most recent green candle in an uptrend or above the high of the most recent red candle in a downtrend.
Confirming Signals: Heiken Ashi "better" candles should be used in conjunction with other technical indicators, such as moving averages, oscillators, or chart patterns, to confirm signals and improve the accuracy of your analysis.
In this implementation, you have the choice of AMA, KAMA, or T3 smoothing. These are as follows:
Kaufman Adaptive Moving Average (KAMA)
The Kaufman Adaptive Moving Average (KAMA) is a type of adaptive moving average used in technical analysis to smooth out price fluctuations and identify trends. The KAMA adjusts its smoothing factor based on the market's volatility, making it more responsive in volatile markets and smoother in calm markets. The KAMA is calculated using three different efficiency ratios that determine the appropriate smoothing factor for the current market conditions. These ratios are based on the noise level of the market, the speed at which the market is moving, and the length of the moving average. The KAMA is a popular choice among traders who prefer to use adaptive indicators to identify trends and potential reversals.
Adaptive Moving Average
The Adaptive Moving Average (AMA) is a type of moving average that adjusts its sensitivity to price movements based on market conditions. It uses a ratio between the current price and the highest and lowest prices over a certain lookback period to determine its level of smoothing. The AMA can help reduce lag and increase responsiveness to changes in trend direction, making it useful for traders who want to follow trends while avoiding false signals. The AMA is calculated by multiplying a smoothing constant with the difference between the current price and the previous AMA value, then adding the result to the previous AMA value.
T3
The T3 moving average is a type of technical indicator used in financial analysis to identify trends in price movements. It is similar to the Exponential Moving Average (EMA) and the Double Exponential Moving Average (DEMA), but uses a different smoothing algorithm.
The T3 moving average is calculated using a series of exponential moving averages that are designed to filter out noise and smooth the data. The resulting smoothed data is then weighted with a non-linear function to produce a final output that is more responsive to changes in trend direction.
The T3 moving average can be customized by adjusting the length of the moving average, as well as the weighting function used to smooth the data. It is commonly used in conjunction with other technical indicators as part of a larger trading strategy.
█ Giga Kaleidoscope Modularized Trading System
Core components of an NNFX algorithmic trading strategy
The NNFX algorithm is built on the principles of trend, momentum, and volatility. There are six core components in the NNFX trading algorithm:
1. Volatility - price volatility; e.g., Average True Range, True Range Double, Close-to-Close, etc.
2. Baseline - a moving average to identify price trend
3. Confirmation 1 - a technical indicator used to identify trends
4. Confirmation 2 - a technical indicator used to identify trends
5. Continuation - a technical indicator used to identify trends
6. Volatility/Volume - a technical indicator used to identify volatility/volume breakouts/breakdown
7. Exit - a technical indicator used to determine when a trend is exhausted
What is Volatility in the NNFX trading system?
In the NNFX (No Nonsense Forex) trading system, ATR (Average True Range) is typically used to measure the volatility of an asset. It is used as a part of the system to help determine the appropriate stop loss and take profit levels for a trade. ATR is calculated by taking the average of the true range values over a specified period.
True range is calculated as the maximum of the following values:
-Current high minus the current low
-Absolute value of the current high minus the previous close
-Absolute value of the current low minus the previous close
ATR is a dynamic indicator that changes with changes in volatility. As volatility increases, the value of ATR increases, and as volatility decreases, the value of ATR decreases. By using ATR in NNFX system, traders can adjust their stop loss and take profit levels according to the volatility of the asset being traded. This helps to ensure that the trade is given enough room to move, while also minimizing potential losses.
Other types of volatility include True Range Double (TRD), Close-to-Close, and Garman-Klass
What is a Baseline indicator?
The baseline is essentially a moving average, and is used to determine the overall direction of the market.
The baseline in the NNFX system is used to filter out trades that are not in line with the long-term trend of the market. The baseline is plotted on the chart along with other indicators, such as the Moving Average (MA), the Relative Strength Index (RSI), and the Average True Range (ATR).
Trades are only taken when the price is in the same direction as the baseline. For example, if the baseline is sloping upwards, only long trades are taken, and if the baseline is sloping downwards, only short trades are taken. This approach helps to ensure that trades are in line with the overall trend of the market, and reduces the risk of entering trades that are likely to fail.
By using a baseline in the NNFX system, traders can have a clear reference point for determining the overall trend of the market, and can make more informed trading decisions. The baseline helps to filter out noise and false signals, and ensures that trades are taken in the direction of the long-term trend.
What is a Confirmation indicator?
Confirmation indicators are technical indicators that are used to confirm the signals generated by primary indicators. Primary indicators are the core indicators used in the NNFX system, such as the Average True Range (ATR), the Moving Average (MA), and the Relative Strength Index (RSI).
The purpose of the confirmation indicators is to reduce false signals and improve the accuracy of the trading system. They are designed to confirm the signals generated by the primary indicators by providing additional information about the strength and direction of the trend.
Some examples of confirmation indicators that may be used in the NNFX system include the Bollinger Bands, the MACD (Moving Average Convergence Divergence), and the MACD Oscillator. These indicators can provide information about the volatility, momentum, and trend strength of the market, and can be used to confirm the signals generated by the primary indicators.
In the NNFX system, confirmation indicators are used in combination with primary indicators and other filters to create a trading system that is robust and reliable. By using multiple indicators to confirm trading signals, the system aims to reduce the risk of false signals and improve the overall profitability of the trades.
What is a Continuation indicator?
In the NNFX (No Nonsense Forex) trading system, a continuation indicator is a technical indicator that is used to confirm a current trend and predict that the trend is likely to continue in the same direction. A continuation indicator is typically used in conjunction with other indicators in the system, such as a baseline indicator, to provide a comprehensive trading strategy.
What is a Volatility/Volume indicator?
Volume indicators, such as the On Balance Volume (OBV), the Chaikin Money Flow (CMF), or the Volume Price Trend (VPT), are used to measure the amount of buying and selling activity in a market. They are based on the trading volume of the market, and can provide information about the strength of the trend. In the NNFX system, volume indicators are used to confirm trading signals generated by the Moving Average and the Relative Strength Index. Volatility indicators include Average Direction Index, Waddah Attar, and Volatility Ratio. In the NNFX trading system, volatility is a proxy for volume and vice versa.
By using volume indicators as confirmation tools, the NNFX trading system aims to reduce the risk of false signals and improve the overall profitability of trades. These indicators can provide additional information about the market that is not captured by the primary indicators, and can help traders to make more informed trading decisions. In addition, volume indicators can be used to identify potential changes in market trends and to confirm the strength of price movements.
What is an Exit indicator?
The exit indicator is used in conjunction with other indicators in the system, such as the Moving Average (MA), the Relative Strength Index (RSI), and the Average True Range (ATR), to provide a comprehensive trading strategy.
The exit indicator in the NNFX system can be any technical indicator that is deemed effective at identifying optimal exit points. Examples of exit indicators that are commonly used include the Parabolic SAR, the Average Directional Index (ADX), and the Chandelier Exit.
The purpose of the exit indicator is to identify when a trend is likely to reverse or when the market conditions have changed, signaling the need to exit a trade. By using an exit indicator, traders can manage their risk and prevent significant losses.
In the NNFX system, the exit indicator is used in conjunction with a stop loss and a take profit order to maximize profits and minimize losses. The stop loss order is used to limit the amount of loss that can be incurred if the trade goes against the trader, while the take profit order is used to lock in profits when the trade is moving in the trader's favor.
Overall, the use of an exit indicator in the NNFX trading system is an important component of a comprehensive trading strategy. It allows traders to manage their risk effectively and improve the profitability of their trades by exiting at the right time.
How does Loxx's GKD (Giga Kaleidoscope Modularized Trading System) implement the NNFX algorithm outlined above?
Loxx's GKD v1.0 system has five types of modules (indicators/strategies). These modules are:
1. GKD-BT - Backtesting module (Volatility, Number 1 in the NNFX algorithm)
2. GKD-B - Baseline module (Baseline and Volatility/Volume, Numbers 1 and 2 in the NNFX algorithm)
3. GKD-C - Confirmation 1/2 and Continuation module (Confirmation 1/2 and Continuation, Numbers 3, 4, and 5 in the NNFX algorithm)
4. GKD-V - Volatility/Volume module (Confirmation 1/2, Number 6 in the NNFX algorithm)
5. GKD-E - Exit module (Exit, Number 7 in the NNFX algorithm)
(additional module types will added in future releases)
Each module interacts with every module by passing data between modules. Data is passed between each module as described below:
GKD-B => GKD-V => GKD-C(1) => GKD-C(2) => GKD-C(Continuation) => GKD-E => GKD-BT
That is, the Baseline indicator passes its data to Volatility/Volume. The Volatility/Volume indicator passes its values to the Confirmation 1 indicator. The Confirmation 1 indicator passes its values to the Confirmation 2 indicator. The Confirmation 2 indicator passes its values to the Continuation indicator. The Continuation indicator passes its values to the Exit indicator, and finally, the Exit indicator passes its values to the Backtest strategy.
This chaining of indicators requires that each module conform to Loxx's GKD protocol, therefore allowing for the testing of every possible combination of technical indicators that make up the six components of the NNFX algorithm.
What does the application of the GKD trading system look like?
Example trading system:
Backtest: Strategy with 1-3 take profits, trailing stop loss, multiple types of PnL volatility, and 2 backtesting styles
Baseline: Hull Moving Average
Volatility/Volume: Hurst Exponent
Confirmation 1: Polychromatic Momentum as shown on the chart above
Confirmation 2: Williams Percent Range
Continuation: Polychromatic Momentum
Exit: Rex Oscillator
Each GKD indicator is denoted with a module identifier of either: GKD-BT, GKD-B, GKD-C, GKD-V, or GKD-E. This allows traders to understand to which module each indicator belongs and where each indicator fits into the GKD protocol chain.
Giga Kaleidoscope Modularized Trading System Signals (based on the NNFX algorithm)
Standard Entry
1. GKD-C Confirmation 1 Signal
2. GKD-B Baseline agrees
3. Price is within a range of 0.2x Volatility and 1.0x Volatility of the Goldie Locks Mean
4. GKD-C Confirmation 2 agrees
5. GKD-V Volatility/Volume agrees
Baseline Entry
1. GKD-B Baseline signal
2. GKD-C Confirmation 1 agrees
3. Price is within a range of 0.2x Volatility and 1.0x Volatility of the Goldie Locks Mean
4. GKD-C Confirmation 2 agrees
5. GKD-V Volatility/Volume agrees
6. GKD-C Confirmation 1 signal was less than 7 candles prior
Volatility/Volume Entry
1. GKD-V Volatility/Volume signal
2. GKD-C Confirmation 1 agrees
3. Price is within a range of 0.2x Volatility and 1.0x Volatility of the Goldie Locks Mean
4. GKD-C Confirmation 2 agrees
5. GKD-B Baseline agrees
6. GKD-C Confirmation 1 signal was less than 7 candles prior
Continuation Entry
1. Standard Entry, Baseline Entry, or Pullback; entry triggered previously
2. GKD-B Baseline hasn't crossed since entry signal trigger
3. GKD-C Confirmation Continuation Indicator signals
4. GKD-C Confirmation 1 agrees
5. GKD-B Baseline agrees
6. GKD-C Confirmation 2 agrees
1-Candle Rule Standard Entry
1. GKD-C Confirmation 1 signal
2. GKD-B Baseline agrees
3. Price is within a range of 0.2x Volatility and 1.0x Volatility of the Goldie Locks Mean
Next Candle:
1. Price retraced (Long: close < close or Short: close > close )
2. GKD-B Baseline agrees
3. GKD-C Confirmation 1 agrees
4. GKD-C Confirmation 2 agrees
5. GKD-V Volatility/Volume agrees
1-Candle Rule Baseline Entry
1. GKD-B Baseline signal
2. GKD-C Confirmation 1 agrees
3. Price is within a range of 0.2x Volatility and 1.0x Volatility of the Goldie Locks Mean
4. GKD-C Confirmation 1 signal was less than 7 candles prior
Next Candle:
1. Price retraced (Long: close < close or Short: close > close )
2. GKD-B Baseline agrees
3. GKD-C Confirmation 1 agrees
4. GKD-C Confirmation 2 agrees
5. GKD-V Volatility/Volume Agrees
1-Candle Rule Volatility/Volume Entry
1. GKD-V Volatility/Volume signal
2. GKD-C Confirmation 1 agrees
3. Price is within a range of 0.2x Volatility and 1.0x Volatility of the Goldie Locks Mean
4. GKD-C Confirmation 1 signal was less than 7 candles prior
Next Candle:
1. Price retraced (Long: close < close or Short: close > close)
2. GKD-B Volatility/Volume agrees
3. GKD-C Confirmation 1 agrees
4. GKD-C Confirmation 2 agrees
5. GKD-B Baseline agrees
PullBack Entry
1. GKD-B Baseline signal
2. GKD-C Confirmation 1 agrees
3. Price is beyond 1.0x Volatility of Baseline
Next Candle:
1. Price is within a range of 0.2x Volatility and 1.0x Volatility of the Goldie Locks Mean
2. GKD-C Confirmation 1 agrees
3. GKD-C Confirmation 2 agrees
4. GKD-V Volatility/Volume Agrees
]█ Setting up the GKD
The GKD system involves chaining indicators together. These are the steps to set this up.
Use a GKD-C indicator alone on a chart
1. Inside the GKD-C indicator, change the "Confirmation Type" setting to "Solo Confirmation Simple"
Use a GKD-V indicator alone on a chart
**nothing, it's already useable on the chart without any settings changes
Use a GKD-B indicator alone on a chart
**nothing, it's already useable on the chart without any settings changes
Baseline (Baseline, Backtest)
1. Import the GKD-B Baseline into the GKD-BT Backtest: "Input into Volatility/Volume or Backtest (Baseline testing)"
2. Inside the GKD-BT Backtest, change the setting "Backtest Special" to "Baseline"
Volatility/Volume (Volatility/Volume, Backte st)
1. Inside the GKD-V indicator, change the "Testing Type" setting to "Solo"
2. Inside the GKD-V indicator, change the "Signal Type" setting to "Crossing" (neither traditional nor both can be backtested)
3. Import the GKD-V indicator into the GKD-BT Backtest: "Input into C1 or Backtest"
4. Inside the GKD-BT Backtest, change the setting "Backtest Special" to "Volatility/Volume"
5. Inside the GKD-BT Backtest, a) change the setting "Backtest Type" to "Trading" if using a directional GKD-V indicator; or, b) change the setting "Backtest Type" to "Full" if using a directional or non-directional GKD-V indicator (non-directional GKD-V can only test Longs and Shorts separately)
6. If "Backtest Type" is set to "Full": Inside the GKD-BT Backtest, change the setting "Backtest Side" to "Long" or "Short
7. If "Backtest Type" is set to "Full": To allow the system to open multiple orders at one time so you test all Longs or Shorts, open the GKD-BT Backtest, click the tab "Properties" and then insert a value of something like 10 orders into the "Pyramiding" settings. This will allow 10 orders to be opened at one time which should be enough to catch all possible Longs or Shorts.
Solo Confirmation Simple (Confirmation, Backtest)
1. Inside the GKD-C indicator, change the "Confirmation Type" setting to "Solo Confirmation Simple"
1. Import the GKD-C indicator into the GKD-BT Backtest: "Input into Backtest"
2. Inside the GKD-BT Backtest, change the setting "Backtest Special" to "Solo Confirmation Simple"
Solo Confirmation Complex without Exits (Baseline, Volatility/Volume, Confirmation, Backtest)
1. Inside the GKD-V indicator, change the "Testing Type" setting to "Chained"
2. Import the GKD-B Baseline into the GKD-V indicator: "Input into Volatility/Volume or Backtest (Baseline testing)"
3. Inside the GKD-C indicator, change the "Confirmation Type" setting to "Solo Confirmation Complex"
4. Import the GKD-V indicator into the GKD-C indicator: "Input into C1 or Backtest"
5. Inside the GKD-BT Backtest, change the setting "Backtest Special" to "GKD Full wo/ Exits"
6. Import the GKD-C into the GKD-BT Backtest: "Input into Exit or Backtest"
Solo Confirmation Complex with Exits (Baseline, Volatility/Volume, Confirmation, Exit, Backtest)
1. Inside the GKD-V indicator, change the "Testing Type" setting to "Chained"
2. Import the GKD-B Baseline into the GKD-V indicator: "Input into Volatility/Volume or Backtest (Baseline testing)"
3. Inside the GKD-C indicator, change the "Confirmation Type" setting to "Solo Confirmation Complex"
4. Import the GKD-V indicator into the GKD-C indicator: "Input into C1 or Backtest"
5. Import the GKD-C indicator into the GKD-E indicator: "Input into Exit"
6. Inside the GKD-BT Backtest, change the setting "Backtest Special" to "GKD Full w/ Exits"
7. Import the GKD-E into the GKD-BT Backtest: "Input into Backtest"
Full GKD without Exits (Baseline, Volatility/Volume, Confirmation 1, Confirmation 2, Continuation, Backtest)
1. Inside the GKD-V indicator, change the "Testing Type" setting to "Chained"
2. Import the GKD-B Baseline into the GKD-V indicator: "Input into Volatility/Volume or Backtest (Baseline testing)"
3. Inside the GKD-C 1 indicator, change the "Confirmation Type" setting to "Confirmation 1"
4. Import the GKD-V indicator into the GKD-C 1 indicator: "Input into C1 or Backtest"
5. Inside the GKD-C 2 indicator, change the "Confirmation Type" setting to "Confirmation 2"
6. Import the GKD-C 1 indicator into the GKD-C 2 indicator: "Input into C2"
7. Inside the GKD-C Continuation indicator, change the "Confirmation Type" setting to "Continuation"
8. Inside the GKD-BT Backtest, change the setting "Backtest Special" to "GKD Full wo/ Exits"
9. Import the GKD-E into the GKD-BT Backtest: "Input into Exit or Backtest"
Full GKD with Exits (Baseline, Volatility/Volume, Confirmation 1, Confirmation 2, Continuation, Exit, Backtest)
1. Inside the GKD-V indicator, change the "Testing Type" setting to "Chained"
2. Import the GKD-B Baseline into the GKD-V indicator: "Input into Volatility/Volume or Backtest (Baseline testing)"
3. Inside the GKD-C 1 indicator, change the "Confirmation Type" setting to "Confirmation 1"
4. Import the GKD-V indicator into the GKD-C 1 indicator: "Input into C1 or Backtest"
5. Inside the GKD-C 2 indicator, change the "Confirmation Type" setting to "Confirmation 2"
6. Import the GKD-C 1 indicator into the GKD-C 2 indicator: "Input into C2"
7. Inside the GKD-C Continuation indicator, change the "Confirmation Type" setting to "Continuation"
8. Import the GKD-C Continuation indicator into the GKD-E indicator: "Input into Exit"
9. Inside the GKD-BT Backtest, change the setting "Backtest Special" to "GKD Full w/ Exits"
10. Import the GKD-E into the GKD-BT Backtest: "Input into Backtest"
Baseline + Volatility/Volume (Baseline, Volatility/Volume, Backtest)
1. Inside the GKD-V indicator, change the "Testing Type" setting to "Baseline + Volatility/Volume"
2. Inside the GKD-V indicator, make sure the "Signal Type" setting is set to "Traditional"
3. Import the GKD-B Baseline into the GKD-V indicator: "Input into Volatility/Volume or Backtest (Baseline testing)"
4. Inside the GKD-BT Backtest, change the setting "Backtest Special" to "Baseline + Volatility/Volume"
5. Import the GKD-V into the GKD-BT Backtest: "Input into C1 or Backtest"
6. Inside the GKD-BT Backtest, change the setting "Backtest Type" to "Full". For this backtest, you must test Longs and Shorts separately
7. To allow the system to open multiple orders at one time so you can test all Longs or Shorts, open the GKD-BT Backtest, click the tab "Properties" and then insert a value of something like 10 orders into the "Pyramiding" settings. This will allow 10 orders to be opened at one time which should be enough to catch all possible Longs or Shorts.
Requirements
Inputs
Confirmation 1: GKD-V Volatility / Volume indicator
Confirmation 2: GKD-C Confirmation indicator
Continuation: GKD-C Confirmation indicator
Solo Confirmation Simple: GKD-B Baseline
Solo Confirmation Complex: GKD-V Volatility / Volume indicator
Solo Confirmation Super Complex: GKD-V Volatility / Volume indicator
Stacked 1: None
Stacked 2+: GKD-C, GKD-V, or GKD-B Stacked 1
Outputs
Confirmation 1: GKD-C Confirmation 2 indicator
Confirmation 2: GKD-C Continuation indicator
Continuation: GKD-E Exit indicator
Solo Confirmation Simple: GKD-BT Backtest
Solo Confirmation Complex: GKD-BT Backtest or GKD-E Exit indicator
Solo Confirmation Super Complex: GKD-C Continuation indicator
Stacked 1: GKD-C, GKD-V, or GKD-B Stacked 2+
Stacked 2+: GKD-C, GKD-V, or GKD-B Stacked 2+ or GKD-BT Backtest
Additional features will be added in future releases.
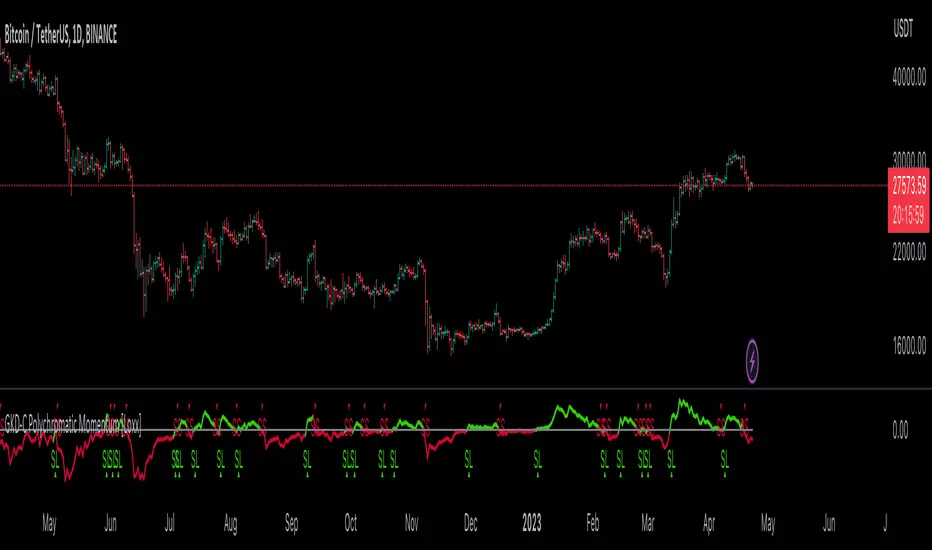
GKD-C RSI T3 [Loxx]Giga Kaleidoscope GKD-C RSI T3 is a Confirmation module included in Loxx's "Giga Kaleidoscope Modularized Trading System".
█ GKD-C RSI T3
RSI T3 vs. Original RSI
The Relative Strength Index (RSI), developed by J. Welles Wilder Jr. in 1978, is a widely used momentum oscillator for determining overbought and oversold market conditions. The T3 Relative Strength Index (RSI T3) builds on the original RSI by incorporating the T3 Moving Average to provide enhanced smoothing and responsiveness. This article delves into the history of the T3 Moving Average, outlines the differences between the RSI T3 and the original RSI, and highlights the benefits of using the RSI T3 for trading purposes.
Original RSI: Foundation and Limitations
The original RSI measures the speed and magnitude of price changes to identify overbought and oversold market conditions. The RSI oscillates between 0 and 100, with values above 70 suggesting overbought conditions and values below 30 indicating oversold conditions. Despite its widespread use, the original RSI has some limitations, including its sensitivity to price fluctuations, which can lead to false signals.
T3 Moving Average: History and Characteristics
The T3 Moving Average was developed by Tim Tillson in 1998 to address the limitations of traditional moving averages, such as lag and overshoot. Tillson's T3 Moving Average is a more responsive and smoother moving average, using a unique recursive calculation to minimize lag and overshoot. This enhanced performance is achieved through a combination of exponential moving averages and a volume factor that adjusts the degree of smoothing.
RSI T3: Integrating T3 Moving Average into RSI
The RSI T3 combines the original RSI formula with the T3 Moving Average to overcome the limitations of the original RSI. By integrating the T3 Moving Average, the RSI T3 offers traders a smoother and more responsive momentum oscillator that is less prone to false signals and erratic movements.
Comparing RSI T3 and Original RSI
The key differences between the RSI T3 and the original RSI lie in their calculation methods and responsiveness. The RSI T3 incorporates the T3 Moving Average, leading to improved smoothing and a more accurate representation of price momentum. This integration results in a momentum oscillator that is less sensitive to sudden price fluctuations, thus reducing the occurrence of false signals and allowing for more reliable trading decisions.
Benefits of RSI T3 for Traders
Traders, regardless of their programming expertise, can benefit from using the RSI T3 in various ways:
1. Improved signal reliability: The RSI T3's enhanced smoothing reduces false signals and erratic movements, leading to more dependable buy and sell signals.
2. Enhanced responsiveness: The RSI T3 is more responsive to price changes, making it easier to identify trend reversals and market momentum shifts.
3. Divergence analysis: Like the original RSI, the RSI T3 can be used to spot divergences between price and the oscillator, potentially signaling reversals or trend exhaustion.
The RSI T3 is an advanced momentum oscillator that builds on the original RSI by incorporating the T3 Moving Average. Its historical roots in addressing the limitations of traditional moving averages make it a valuable tool for traders seeking a more responsive and reliable momentum indicator. By understanding the differences between the RSI T3 and the original RSI, traders can make more informed decisions and enhance their overall trading performance.
Additional Features
This indicator allows you to select from 33 source types. They are as follows:
Close
Open
High
Low
Median
Typical
Weighted
Average
Average Median Body
Trend Biased
Trend Biased (Extreme)
HA Close
HA Open
HA High
HA Low
HA Median
HA Typical
HA Weighted
HA Average
HA Average Median Body
HA Trend Biased
HA Trend Biased (Extreme)
HAB Close
HAB Open
HAB High
HAB Low
HAB Median
HAB Typical
HAB Weighted
HAB Average
HAB Average Median Body
HAB Trend Biased
HAB Trend Biased (Extreme)
What are Heiken Ashi "better" candles?
Heiken Ashi "better" candles are a modified version of the standard Heiken Ashi candles, which are a popular charting technique used in technical analysis. Heiken Ashi candles help traders identify trends and potential reversal points by smoothing out price data and reducing market noise. The "better formula" was proposed by Sebastian Schmidt in an article published by BNP Paribas in Warrants & Zertifikate, a German magazine, in August 2004. The aim of this formula is to further improve the smoothing of the Heiken Ashi chart and enhance its effectiveness in identifying trends and reversals.
Standard Heiken Ashi candles are calculated using the following formulas:
Heiken Ashi Close = (Open + High + Low + Close) / 4
Heiken Ashi Open = (Previous Heiken Ashi Open + Previous Heiken Ashi Close) / 2
Heiken Ashi High = Max (High, Heiken Ashi Open, Heiken Ashi Close)
Heiken Ashi Low = Min (Low, Heiken Ashi Open, Heiken Ashi Close)
The "better formula" modifies the standard Heiken Ashi calculation by incorporating additional smoothing, which can help reduce noise and make it easier to identify trends and reversals. The modified formulas for Heiken Ashi "better" candles are as follows:
Better Heiken Ashi Close = (Open + High + Low + Close) / 4
Better Heiken Ashi Open = (Previous Better Heiken Ashi Open + Previous Better Heiken Ashi Close) / 2
Better Heiken Ashi High = Max (High, Better Heiken Ashi Open, Better Heiken Ashi Close)
Better Heiken Ashi Low = Min (Low, Better Heiken Ashi Open, Better Heiken Ashi Close)
Smoothing Factor = 2 / (N + 1), where N is the chosen period for smoothing
Smoothed Better Heiken Ashi Open = (Better Heiken Ashi Open * Smoothing Factor) + (Previous Smoothed Better Heiken Ashi Open * (1 - Smoothing Factor))
Smoothed Better Heiken Ashi Close = (Better Heiken Ashi Close * Smoothing Factor) + (Previous Smoothed Better Heiken Ashi Close * (1 - Smoothing Factor))
The smoothed Better Heiken Ashi Open and Close values are then used to calculate the smoothed Better Heiken Ashi High and Low values, resulting in "better" candles that provide a clearer representation of the market trend and potential reversal points.
It's important to note that, like any other technical analysis tool, Heiken Ashi "better" candles are not foolproof and should be used in conjunction with other indicators and analysis techniques to make well-informed trading decisions.
Heiken Ashi "better" candles, as mentioned previously, provide a clearer representation of market trends and potential reversal points by reducing noise and smoothing out price data. When using these candles in conjunction with other technical analysis tools and indicators, traders can gain valuable insights into market behavior and make more informed decisions.
To effectively use Heiken Ashi "better" candles in your trading strategy, consider the following tips:
Trend Identification: Heiken Ashi "better" candles can help you identify the prevailing trend in the market. When the majority of the candles are green (or another color, depending on your chart settings) and there are no or few lower wicks, it may indicate a strong uptrend. Conversely, when the majority of the candles are red (or another color) and there are no or few upper wicks, it may signal a strong downtrend.
Trend Reversals: Look for potential trend reversals when a change in the color of the candles occurs, especially when accompanied by longer wicks. For example, if a green candle with a long lower wick is followed by a red candle, it could indicate a bearish reversal. Similarly, a red candle with a long upper wick followed by a green candle may suggest a bullish reversal.
Support and Resistance: You can use Heiken Ashi "better" candles to identify potential support and resistance levels. When the candles are consistently moving in one direction and then suddenly change color with longer wicks, it could indicate the presence of a support or resistance level.
Stop-Loss and Take-Profit: Using Heiken Ashi "better" candles can help you manage risk by determining optimal stop-loss and take-profit levels. For instance, you can place your stop-loss below the low of the most recent green candle in an uptrend or above the high of the most recent red candle in a downtrend.
Confirming Signals: Heiken Ashi "better" candles should be used in conjunction with other technical indicators, such as moving averages, oscillators, or chart patterns, to confirm signals and improve the accuracy of your analysis.
In this implementation, you have the choice of AMA, KAMA, or T3 smoothing. These are as follows:
Kaufman Adaptive Moving Average (KAMA)
The Kaufman Adaptive Moving Average (KAMA) is a type of adaptive moving average used in technical analysis to smooth out price fluctuations and identify trends. The KAMA adjusts its smoothing factor based on the market's volatility, making it more responsive in volatile markets and smoother in calm markets. The KAMA is calculated using three different efficiency ratios that determine the appropriate smoothing factor for the current market conditions. These ratios are based on the noise level of the market, the speed at which the market is moving, and the length of the moving average. The KAMA is a popular choice among traders who prefer to use adaptive indicators to identify trends and potential reversals.
Adaptive Moving Average
The Adaptive Moving Average (AMA) is a type of moving average that adjusts its sensitivity to price movements based on market conditions. It uses a ratio between the current price and the highest and lowest prices over a certain lookback period to determine its level of smoothing. The AMA can help reduce lag and increase responsiveness to changes in trend direction, making it useful for traders who want to follow trends while avoiding false signals. The AMA is calculated by multiplying a smoothing constant with the difference between the current price and the previous AMA value, then adding the result to the previous AMA value.
T3
The T3 moving average is a type of technical indicator used in financial analysis to identify trends in price movements. It is similar to the Exponential Moving Average (EMA) and the Double Exponential Moving Average (DEMA), but uses a different smoothing algorithm.
The T3 moving average is calculated using a series of exponential moving averages that are designed to filter out noise and smooth the data. The resulting smoothed data is then weighted with a non-linear function to produce a final output that is more responsive to changes in trend direction.
The T3 moving average can be customized by adjusting the length of the moving average, as well as the weighting function used to smooth the data. It is commonly used in conjunction with other technical indicators as part of a larger trading strategy.
█ Giga Kaleidoscope Modularized Trading System
Core components of an NNFX algorithmic trading strategy
The NNFX algorithm is built on the principles of trend, momentum, and volatility. There are six core components in the NNFX trading algorithm:
1. Volatility - price volatility; e.g., Average True Range, True Range Double, Close-to-Close, etc.
2. Baseline - a moving average to identify price trend
3. Confirmation 1 - a technical indicator used to identify trends
4. Confirmation 2 - a technical indicator used to identify trends
5. Continuation - a technical indicator used to identify trends
6. Volatility/Volume - a technical indicator used to identify volatility/volume breakouts/breakdown
7. Exit - a technical indicator used to determine when a trend is exhausted
What is Volatility in the NNFX trading system?
In the NNFX (No Nonsense Forex) trading system, ATR (Average True Range) is typically used to measure the volatility of an asset. It is used as a part of the system to help determine the appropriate stop loss and take profit levels for a trade. ATR is calculated by taking the average of the true range values over a specified period.
True range is calculated as the maximum of the following values:
-Current high minus the current low
-Absolute value of the current high minus the previous close
-Absolute value of the current low minus the previous close
ATR is a dynamic indicator that changes with changes in volatility. As volatility increases, the value of ATR increases, and as volatility decreases, the value of ATR decreases. By using ATR in NNFX system, traders can adjust their stop loss and take profit levels according to the volatility of the asset being traded. This helps to ensure that the trade is given enough room to move, while also minimizing potential losses.
Other types of volatility include True Range Double (TRD), Close-to-Close, and Garman-Klass
What is a Baseline indicator?
The baseline is essentially a moving average, and is used to determine the overall direction of the market.
The baseline in the NNFX system is used to filter out trades that are not in line with the long-term trend of the market. The baseline is plotted on the chart along with other indicators, such as the Moving Average (MA), the Relative Strength Index (RSI), and the Average True Range (ATR).
Trades are only taken when the price is in the same direction as the baseline. For example, if the baseline is sloping upwards, only long trades are taken, and if the baseline is sloping downwards, only short trades are taken. This approach helps to ensure that trades are in line with the overall trend of the market, and reduces the risk of entering trades that are likely to fail.
By using a baseline in the NNFX system, traders can have a clear reference point for determining the overall trend of the market, and can make more informed trading decisions. The baseline helps to filter out noise and false signals, and ensures that trades are taken in the direction of the long-term trend.
What is a Confirmation indicator?
Confirmation indicators are technical indicators that are used to confirm the signals generated by primary indicators. Primary indicators are the core indicators used in the NNFX system, such as the Average True Range (ATR), the Moving Average (MA), and the Relative Strength Index (RSI).
The purpose of the confirmation indicators is to reduce false signals and improve the accuracy of the trading system. They are designed to confirm the signals generated by the primary indicators by providing additional information about the strength and direction of the trend.
Some examples of confirmation indicators that may be used in the NNFX system include the Bollinger Bands, the MACD (Moving Average Convergence Divergence), and the MACD Oscillator. These indicators can provide information about the volatility, momentum, and trend strength of the market, and can be used to confirm the signals generated by the primary indicators.
In the NNFX system, confirmation indicators are used in combination with primary indicators and other filters to create a trading system that is robust and reliable. By using multiple indicators to confirm trading signals, the system aims to reduce the risk of false signals and improve the overall profitability of the trades.
What is a Continuation indicator?
In the NNFX (No Nonsense Forex) trading system, a continuation indicator is a technical indicator that is used to confirm a current trend and predict that the trend is likely to continue in the same direction. A continuation indicator is typically used in conjunction with other indicators in the system, such as a baseline indicator, to provide a comprehensive trading strategy.
What is a Volatility/Volume indicator?
Volume indicators, such as the On Balance Volume (OBV), the Chaikin Money Flow (CMF), or the Volume Price Trend (VPT), are used to measure the amount of buying and selling activity in a market. They are based on the trading volume of the market, and can provide information about the strength of the trend. In the NNFX system, volume indicators are used to confirm trading signals generated by the Moving Average and the Relative Strength Index. Volatility indicators include Average Direction Index, Waddah Attar, and Volatility Ratio. In the NNFX trading system, volatility is a proxy for volume and vice versa.
By using volume indicators as confirmation tools, the NNFX trading system aims to reduce the risk of false signals and improve the overall profitability of trades. These indicators can provide additional information about the market that is not captured by the primary indicators, and can help traders to make more informed trading decisions. In addition, volume indicators can be used to identify potential changes in market trends and to confirm the strength of price movements.
What is an Exit indicator?
The exit indicator is used in conjunction with other indicators in the system, such as the Moving Average (MA), the Relative Strength Index (RSI), and the Average True Range (ATR), to provide a comprehensive trading strategy.
The exit indicator in the NNFX system can be any technical indicator that is deemed effective at identifying optimal exit points. Examples of exit indicators that are commonly used include the Parabolic SAR, the Average Directional Index (ADX), and the Chandelier Exit.
The purpose of the exit indicator is to identify when a trend is likely to reverse or when the market conditions have changed, signaling the need to exit a trade. By using an exit indicator, traders can manage their risk and prevent significant losses.
In the NNFX system, the exit indicator is used in conjunction with a stop loss and a take profit order to maximize profits and minimize losses. The stop loss order is used to limit the amount of loss that can be incurred if the trade goes against the trader, while the take profit order is used to lock in profits when the trade is moving in the trader's favor.
Overall, the use of an exit indicator in the NNFX trading system is an important component of a comprehensive trading strategy. It allows traders to manage their risk effectively and improve the profitability of their trades by exiting at the right time.
How does Loxx's GKD (Giga Kaleidoscope Modularized Trading System) implement the NNFX algorithm outlined above?
Loxx's GKD v1.0 system has five types of modules (indicators/strategies). These modules are:
1. GKD-BT - Backtesting module (Volatility, Number 1 in the NNFX algorithm)
2. GKD-B - Baseline module (Baseline and Volatility/Volume, Numbers 1 and 2 in the NNFX algorithm)
3. GKD-C - Confirmation 1/2 and Continuation module (Confirmation 1/2 and Continuation, Numbers 3, 4, and 5 in the NNFX algorithm)
4. GKD-V - Volatility/Volume module (Confirmation 1/2, Number 6 in the NNFX algorithm)
5. GKD-E - Exit module (Exit, Number 7 in the NNFX algorithm)
(additional module types will added in future releases)
Each module interacts with every module by passing data between modules. Data is passed between each module as described below:
GKD-B => GKD-V => GKD-C(1) => GKD-C(2) => GKD-C(Continuation) => GKD-E => GKD-BT
That is, the Baseline indicator passes its data to Volatility/Volume. The Volatility/Volume indicator passes its values to the Confirmation 1 indicator. The Confirmation 1 indicator passes its values to the Confirmation 2 indicator. The Confirmation 2 indicator passes its values to the Continuation indicator. The Continuation indicator passes its values to the Exit indicator, and finally, the Exit indicator passes its values to the Backtest strategy.
This chaining of indicators requires that each module conform to Loxx's GKD protocol, therefore allowing for the testing of every possible combination of technical indicators that make up the six components of the NNFX algorithm.
What does the application of the GKD trading system look like?
Example trading system:
Backtest: Strategy with 1-3 take profits, trailing stop loss, multiple types of PnL volatility, and 2 backtesting styles
Baseline: Hull Moving Average
Volatility/Volume: Hurst Exponent
Confirmation 1: RSI T3 as shown on the chart above
Confirmation 2: Williams Percent Range
Continuation: Fisher Transform
Exit: Rex Oscillator
Each GKD indicator is denoted with a module identifier of either: GKD-BT, GKD-B, GKD-C, GKD-V, or GKD-E. This allows traders to understand to which module each indicator belongs and where each indicator fits into the GKD protocol chain.
Giga Kaleidoscope Modularized Trading System Signals (based on the NNFX algorithm)
Standard Entry
1. GKD-C Confirmation 1 Signal
2. GKD-B Baseline agrees
3. Price is within a range of 0.2x Volatility and 1.0x Volatility of the Goldie Locks Mean
4. GKD-C Confirmation 2 agrees
5. GKD-V Volatility/Volume agrees
Baseline Entry
1. GKD-B Baseline signal
2. GKD-C Confirmation 1 agrees
3. Price is within a range of 0.2x Volatility and 1.0x Volatility of the Goldie Locks Mean
4. GKD-C Confirmation 2 agrees
5. GKD-V Volatility/Volume agrees
6. GKD-C Confirmation 1 signal was less than 7 candles prior
Volatility/Volume Entry
1. GKD-V Volatility/Volume signal
2. GKD-C Confirmation 1 agrees
3. Price is within a range of 0.2x Volatility and 1.0x Volatility of the Goldie Locks Mean
4. GKD-C Confirmation 2 agrees
5. GKD-B Baseline agrees
6. GKD-C Confirmation 1 signal was less than 7 candles prior
Continuation Entry
1. Standard Entry, Baseline Entry, or Pullback; entry triggered previously
2. GKD-B Baseline hasn't crossed since entry signal trigger
3. GKD-C Confirmation Continuation Indicator signals
4. GKD-C Confirmation 1 agrees
5. GKD-B Baseline agrees
6. GKD-C Confirmation 2 agrees
1-Candle Rule Standard Entry
1. GKD-C Confirmation 1 signal
2. GKD-B Baseline agrees
3. Price is within a range of 0.2x Volatility and 1.0x Volatility of the Goldie Locks Mean
Next Candle:
1. Price retraced (Long: close < close or Short: close > close )
2. GKD-B Baseline agrees
3. GKD-C Confirmation 1 agrees
4. GKD-C Confirmation 2 agrees
5. GKD-V Volatility/Volume agrees
1-Candle Rule Baseline Entry
1. GKD-B Baseline signal
2. GKD-C Confirmation 1 agrees
3. Price is within a range of 0.2x Volatility and 1.0x Volatility of the Goldie Locks Mean
4. GKD-C Confirmation 1 signal was less than 7 candles prior
Next Candle:
1. Price retraced (Long: close < close or Short: close > close )
2. GKD-B Baseline agrees
3. GKD-C Confirmation 1 agrees
4. GKD-C Confirmation 2 agrees
5. GKD-V Volatility/Volume Agrees
1-Candle Rule Volatility/Volume Entry
1. GKD-V Volatility/Volume signal
2. GKD-C Confirmation 1 agrees
3. Price is within a range of 0.2x Volatility and 1.0x Volatility of the Goldie Locks Mean
4. GKD-C Confirmation 1 signal was less than 7 candles prior
Next Candle:
1. Price retraced (Long: close < close or Short: close > close)
2. GKD-B Volatility/Volume agrees
3. GKD-C Confirmation 1 agrees
4. GKD-C Confirmation 2 agrees
5. GKD-B Baseline agrees
PullBack Entry
1. GKD-B Baseline signal
2. GKD-C Confirmation 1 agrees
3. Price is beyond 1.0x Volatility of Baseline
Next Candle:
1. Price is within a range of 0.2x Volatility and 1.0x Volatility of the Goldie Locks Mean
2. GKD-C Confirmation 1 agrees
3. GKD-C Confirmation 2 agrees
4. GKD-V Volatility/Volume Agrees
]█ Setting up the GKD
The GKD system involves chaining indicators together. These are the steps to set this up.
Use a GKD-C indicator alone on a chart
1. Inside the GKD-C indicator, change the "Confirmation Type" setting to "Solo Confirmation Simple"
Use a GKD-V indicator alone on a chart
**nothing, it's already useable on the chart without any settings changes
Use a GKD-B indicator alone on a chart
**nothing, it's already useable on the chart without any settings changes
Baseline (Baseline, Backtest)
1. Import the GKD-B Baseline into the GKD-BT Backtest: "Input into Volatility/Volume or Backtest (Baseline testing)"
2. Inside the GKD-BT Backtest, change the setting "Backtest Special" to "Baseline"
Volatility/Volume (Volatility/Volume, Backte st)
1. Inside the GKD-V indicator, change the "Testing Type" setting to "Solo"
2. Inside the GKD-V indicator, change the "Signal Type" setting to "Crossing" (neither traditional nor both can be backtested)
3. Import the GKD-V indicator into the GKD-BT Backtest: "Input into C1 or Backtest"
4. Inside the GKD-BT Backtest, change the setting "Backtest Special" to "Volatility/Volume"
5. Inside the GKD-BT Backtest, a) change the setting "Backtest Type" to "Trading" if using a directional GKD-V indicator; or, b) change the setting "Backtest Type" to "Full" if using a directional or non-directional GKD-V indicator (non-directional GKD-V can only test Longs and Shorts separately)
6. If "Backtest Type" is set to "Full": Inside the GKD-BT Backtest, change the setting "Backtest Side" to "Long" or "Short
7. If "Backtest Type" is set to "Full": To allow the system to open multiple orders at one time so you test all Longs or Shorts, open the GKD-BT Backtest, click the tab "Properties" and then insert a value of something like 10 orders into the "Pyramiding" settings. This will allow 10 orders to be opened at one time which should be enough to catch all possible Longs or Shorts.
Solo Confirmation Simple (Confirmation, Backtest)
1. Inside the GKD-C indicator, change the "Confirmation Type" setting to "Solo Confirmation Simple"
1. Import the GKD-C indicator into the GKD-BT Backtest: "Input into Backtest"
2. Inside the GKD-BT Backtest, change the setting "Backtest Special" to "Solo Confirmation Simple"
Solo Confirmation Complex without Exits (Baseline, Volatility/Volume, Confirmation, Backtest)
1. Inside the GKD-V indicator, change the "Testing Type" setting to "Chained"
2. Import the GKD-B Baseline into the GKD-V indicator: "Input into Volatility/Volume or Backtest (Baseline testing)"
3. Inside the GKD-C indicator, change the "Confirmation Type" setting to "Solo Confirmation Complex"
4. Import the GKD-V indicator into the GKD-C indicator: "Input into C1 or Backtest"
5. Inside the GKD-BT Backtest, change the setting "Backtest Special" to "GKD Full wo/ Exits"
6. Import the GKD-C into the GKD-BT Backtest: "Input into Exit or Backtest"
Solo Confirmation Complex with Exits (Baseline, Volatility/Volume, Confirmation, Exit, Backtest)
1. Inside the GKD-V indicator, change the "Testing Type" setting to "Chained"
2. Import the GKD-B Baseline into the GKD-V indicator: "Input into Volatility/Volume or Backtest (Baseline testing)"
3. Inside the GKD-C indicator, change the "Confirmation Type" setting to "Solo Confirmation Complex"
4. Import the GKD-V indicator into the GKD-C indicator: "Input into C1 or Backtest"
5. Import the GKD-C indicator into the GKD-E indicator: "Input into Exit"
6. Inside the GKD-BT Backtest, change the setting "Backtest Special" to "GKD Full w/ Exits"
7. Import the GKD-E into the GKD-BT Backtest: "Input into Backtest"
Full GKD without Exits (Baseline, Volatility/Volume, Confirmation 1, Confirmation 2, Continuation, Backtest)
1. Inside the GKD-V indicator, change the "Testing Type" setting to "Chained"
2. Import the GKD-B Baseline into the GKD-V indicator: "Input into Volatility/Volume or Backtest (Baseline testing)"
3. Inside the GKD-C 1 indicator, change the "Confirmation Type" setting to "Confirmation 1"
4. Import the GKD-V indicator into the GKD-C 1 indicator: "Input into C1 or Backtest"
5. Inside the GKD-C 2 indicator, change the "Confirmation Type" setting to "Confirmation 2"
6. Import the GKD-C 1 indicator into the GKD-C 2 indicator: "Input into C2"
7. Inside the GKD-C Continuation indicator, change the "Confirmation Type" setting to "Continuation"
8. Inside the GKD-BT Backtest, change the setting "Backtest Special" to "GKD Full wo/ Exits"
9. Import the GKD-E into the GKD-BT Backtest: "Input into Exit or Backtest"
Full GKD with Exits (Baseline, Volatility/Volume, Confirmation 1, Confirmation 2, Continuation, Exit, Backtest)
1. Inside the GKD-V indicator, change the "Testing Type" setting to "Chained"
2. Import the GKD-B Baseline into the GKD-V indicator: "Input into Volatility/Volume or Backtest (Baseline testing)"
3. Inside the GKD-C 1 indicator, change the "Confirmation Type" setting to "Confirmation 1"
4. Import the GKD-V indicator into the GKD-C 1 indicator: "Input into C1 or Backtest"
5. Inside the GKD-C 2 indicator, change the "Confirmation Type" setting to "Confirmation 2"
6. Import the GKD-C 1 indicator into the GKD-C 2 indicator: "Input into C2"
7. Inside the GKD-C Continuation indicator, change the "Confirmation Type" setting to "Continuation"
8. Import the GKD-C Continuation indicator into the GKD-E indicator: "Input into Exit"
9. Inside the GKD-BT Backtest, change the setting "Backtest Special" to "GKD Full w/ Exits"
10. Import the GKD-E into the GKD-BT Backtest: "Input into Backtest"
Baseline + Volatility/Volume (Baseline, Volatility/Volume, Backtest)
1. Inside the GKD-V indicator, change the "Testing Type" setting to "Baseline + Volatility/Volume"
2. Inside the GKD-V indicator, make sure the "Signal Type" setting is set to "Traditional"
3. Import the GKD-B Baseline into the GKD-V indicator: "Input into Volatility/Volume or Backtest (Baseline testing)"
4. Inside the GKD-BT Backtest, change the setting "Backtest Special" to "Baseline + Volatility/Volume"
5. Import the GKD-V into the GKD-BT Backtest: "Input into C1 or Backtest"
6. Inside the GKD-BT Backtest, change the setting "Backtest Type" to "Full". For this backtest, you must test Longs and Shorts separately
7. To allow the system to open multiple orders at one time so you can test all Longs or Shorts, open the GKD-BT Backtest, click the tab "Properties" and then insert a value of something like 10 orders into the "Pyramiding" settings. This will allow 10 orders to be opened at one time which should be enough to catch all possible Longs or Shorts.
Requirements
Inputs
Confirmation 1: GKD-V Volatility / Volume indicator
Confirmation 2: GKD-C Confirmation indicator
Continuation: GKD-C Confirmation indicator
Solo Confirmation Simple: GKD-B Baseline
Solo Confirmation Complex: GKD-V Volatility / Volume indicator
Solo Confirmation Super Complex: GKD-V Volatility / Volume indicator
Stacked 1: None
Stacked 2+: GKD-C, GKD-V, or GKD-B Stacked 1
Outputs
Confirmation 1: GKD-C Confirmation 2 indicator
Confirmation 2: GKD-C Continuation indicator
Continuation: GKD-E Exit indicator
Solo Confirmation Simple: GKD-BT Backtest
Solo Confirmation Complex: GKD-BT Backtest or GKD-E Exit indicator
Solo Confirmation Super Complex: GKD-C Continuation indicator
Stacked 1: GKD-C, GKD-V, or GKD-B Stacked 2+
Stacked 2+: GKD-C, GKD-V, or GKD-B Stacked 2+ or GKD-BT Backtest
Additional features will be added in future releases.
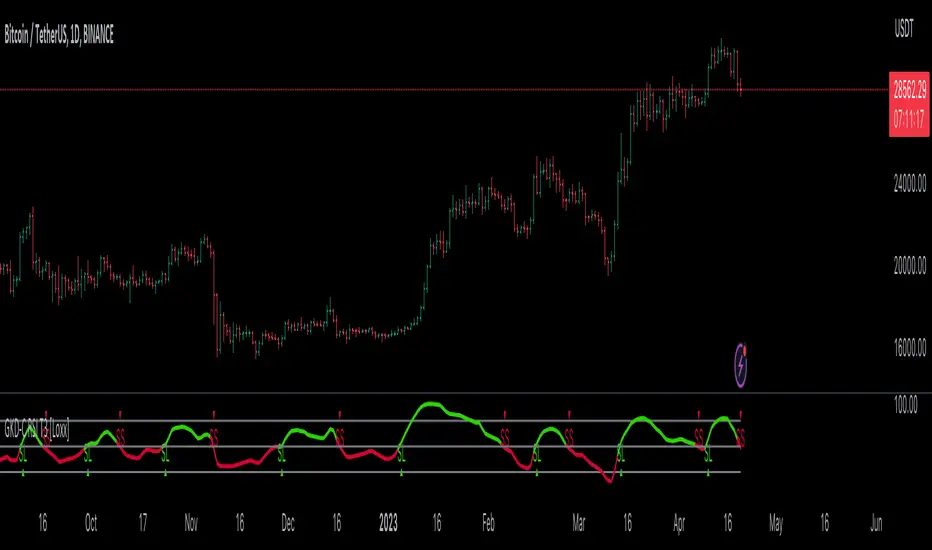
GKD-C RSI DEMA [Loxx]Giga Kaleidoscope GKD-C RSI DEMA is a Confirmation module included in Loxx's "Giga Kaleidoscope Modularized Trading System".
█ GKD-C RSI DEMA
Exploring RSI-DEMA: A Novel Indicator for Technical Analysis in Trading
The world of trading has evolved considerably with the advent of technology and the development of various technical analysis tools. These tools assist traders in making informed decisions based on the historical price movements of financial instruments. One such tool is the Relative Strength Index (RSI), which has been widely used to gauge the momentum of price movements. However, the following explores a new variation of RSI, calculated using the Double Exponential Moving Average (DEMA), which we will refer to as RSI-DEMA.
Background on RSI
The Relative Strength Index (RSI) is a momentum oscillator developed by J. Welles Wilder in 1978. It measures the speed and change of price movements, oscillating between 0 and 100. The RSI is typically used to identify overbought or oversold conditions in a market. An RSI value above 70 suggests an overbought condition, whereas a value below 30 indicates an oversold condition. This information can be valuable for traders in determining potential entry and exit points.
Introducing RSI-DEMA
The RSI-DEMA is a modified version of the traditional RSI that incorporates the Double Exponential Moving Average (DEMA) in its calculation. DEMA, developed by Patrick Mulloy, is a type of moving average that reacts more quickly to recent price changes compared to other moving averages like Simple Moving Average (SMA) and Exponential Moving Average (EMA). By combining RSI with DEMA, the RSI-DEMA aims to provide a more sensitive and responsive momentum oscillator for traders to analyze market conditions.
RSI-DEMA Calculation
The RSI-DEMA formula calculates the RSI-DEMA value for a given input price (src) and period (per). The first step is to compute the alpha value, which is inversely proportional to the square root of the period. Next, the price change is calculated and separated into positive and negative changes. These changes are then smoothed using the DEMA method, which involves two stages of exponential smoothing.
Finally, the smoothed positive and negative changes are divided, and the result is scaled by 50 to obtain the RSI-DEMA value, which oscillates between 0 and 100. This value provides insight into the strength of the price momentum and can be used similarly to the traditional RSI to identify overbought and oversold conditions in the market.
Advantages of RSI-DEMA
The primary advantage of RSI-DEMA over the traditional RSI is its increased sensitivity to recent price changes. By incorporating the DEMA in its calculation, RSI-DEMA reacts more quickly to sudden price movements, potentially providing traders with more timely signals for entry or exit points. This may prove beneficial, especially in fast-paced or volatile market conditions.
In summary, RSI-DEMA is a novel technical indicator that combines the strengths of both RSI and DEMA to provide a more sensitive and responsive momentum oscillator. While the traditional RSI remains a popular and widely-used tool in technical analysis, the RSI-DEMA offers an interesting alternative for traders who seek a more responsive indicator to capture market opportunities in fast-paced and dynamic environments. As with any trading tool, the RSI-DEMA should be used in conjunction with other technical analysis methods and risk management strategies to achieve optimal trading outcomes.
Additional Features
This indicator allows you to select from 33 source types. They are as follows:
Close
Open
High
Low
Median
Typical
Weighted
Average
Average Median Body
Trend Biased
Trend Biased (Extreme)
HA Close
HA Open
HA High
HA Low
HA Median
HA Typical
HA Weighted
HA Average
HA Average Median Body
HA Trend Biased
HA Trend Biased (Extreme)
HAB Close
HAB Open
HAB High
HAB Low
HAB Median
HAB Typical
HAB Weighted
HAB Average
HAB Average Median Body
HAB Trend Biased
HAB Trend Biased (Extreme)
What are Heiken Ashi "better" candles?
Heiken Ashi "better" candles are a modified version of the standard Heiken Ashi candles, which are a popular charting technique used in technical analysis. Heiken Ashi candles help traders identify trends and potential reversal points by smoothing out price data and reducing market noise. The "better formula" was proposed by Sebastian Schmidt in an article published by BNP Paribas in Warrants & Zertifikate, a German magazine, in August 2004. The aim of this formula is to further improve the smoothing of the Heiken Ashi chart and enhance its effectiveness in identifying trends and reversals.
Standard Heiken Ashi candles are calculated using the following formulas:
Heiken Ashi Close = (Open + High + Low + Close) / 4
Heiken Ashi Open = (Previous Heiken Ashi Open + Previous Heiken Ashi Close) / 2
Heiken Ashi High = Max (High, Heiken Ashi Open, Heiken Ashi Close)
Heiken Ashi Low = Min (Low, Heiken Ashi Open, Heiken Ashi Close)
The "better formula" modifies the standard Heiken Ashi calculation by incorporating additional smoothing, which can help reduce noise and make it easier to identify trends and reversals. The modified formulas for Heiken Ashi "better" candles are as follows:
Better Heiken Ashi Close = (Open + High + Low + Close) / 4
Better Heiken Ashi Open = (Previous Better Heiken Ashi Open + Previous Better Heiken Ashi Close) / 2
Better Heiken Ashi High = Max (High, Better Heiken Ashi Open, Better Heiken Ashi Close)
Better Heiken Ashi Low = Min (Low, Better Heiken Ashi Open, Better Heiken Ashi Close)
Smoothing Factor = 2 / (N + 1), where N is the chosen period for smoothing
Smoothed Better Heiken Ashi Open = (Better Heiken Ashi Open * Smoothing Factor) + (Previous Smoothed Better Heiken Ashi Open * (1 - Smoothing Factor))
Smoothed Better Heiken Ashi Close = (Better Heiken Ashi Close * Smoothing Factor) + (Previous Smoothed Better Heiken Ashi Close * (1 - Smoothing Factor))
The smoothed Better Heiken Ashi Open and Close values are then used to calculate the smoothed Better Heiken Ashi High and Low values, resulting in "better" candles that provide a clearer representation of the market trend and potential reversal points.
It's important to note that, like any other technical analysis tool, Heiken Ashi "better" candles are not foolproof and should be used in conjunction with other indicators and analysis techniques to make well-informed trading decisions.
Heiken Ashi "better" candles, as mentioned previously, provide a clearer representation of market trends and potential reversal points by reducing noise and smoothing out price data. When using these candles in conjunction with other technical analysis tools and indicators, traders can gain valuable insights into market behavior and make more informed decisions.
To effectively use Heiken Ashi "better" candles in your trading strategy, consider the following tips:
Trend Identification: Heiken Ashi "better" candles can help you identify the prevailing trend in the market. When the majority of the candles are green (or another color, depending on your chart settings) and there are no or few lower wicks, it may indicate a strong uptrend. Conversely, when the majority of the candles are red (or another color) and there are no or few upper wicks, it may signal a strong downtrend.
Trend Reversals: Look for potential trend reversals when a change in the color of the candles occurs, especially when accompanied by longer wicks. For example, if a green candle with a long lower wick is followed by a red candle, it could indicate a bearish reversal. Similarly, a red candle with a long upper wick followed by a green candle may suggest a bullish reversal.
Support and Resistance: You can use Heiken Ashi "better" candles to identify potential support and resistance levels. When the candles are consistently moving in one direction and then suddenly change color with longer wicks, it could indicate the presence of a support or resistance level.
Stop-Loss and Take-Profit: Using Heiken Ashi "better" candles can help you manage risk by determining optimal stop-loss and take-profit levels. For instance, you can place your stop-loss below the low of the most recent green candle in an uptrend or above the high of the most recent red candle in a downtrend.
Confirming Signals: Heiken Ashi "better" candles should be used in conjunction with other technical indicators, such as moving averages, oscillators, or chart patterns, to confirm signals and improve the accuracy of your analysis.
In this implementation, you have the choice of AMA, KAMA, or T3 smoothing. These are as follows:
Kaufman Adaptive Moving Average (KAMA)
The Kaufman Adaptive Moving Average (KAMA) is a type of adaptive moving average used in technical analysis to smooth out price fluctuations and identify trends. The KAMA adjusts its smoothing factor based on the market's volatility, making it more responsive in volatile markets and smoother in calm markets. The KAMA is calculated using three different efficiency ratios that determine the appropriate smoothing factor for the current market conditions. These ratios are based on the noise level of the market, the speed at which the market is moving, and the length of the moving average. The KAMA is a popular choice among traders who prefer to use adaptive indicators to identify trends and potential reversals.
Adaptive Moving Average
The Adaptive Moving Average (AMA) is a type of moving average that adjusts its sensitivity to price movements based on market conditions. It uses a ratio between the current price and the highest and lowest prices over a certain lookback period to determine its level of smoothing. The AMA can help reduce lag and increase responsiveness to changes in trend direction, making it useful for traders who want to follow trends while avoiding false signals. The AMA is calculated by multiplying a smoothing constant with the difference between the current price and the previous AMA value, then adding the result to the previous AMA value.
T3
The T3 moving average is a type of technical indicator used in financial analysis to identify trends in price movements. It is similar to the Exponential Moving Average (EMA) and the Double Exponential Moving Average (DEMA), but uses a different smoothing algorithm.
The T3 moving average is calculated using a series of exponential moving averages that are designed to filter out noise and smooth the data. The resulting smoothed data is then weighted with a non-linear function to produce a final output that is more responsive to changes in trend direction.
The T3 moving average can be customized by adjusting the length of the moving average, as well as the weighting function used to smooth the data. It is commonly used in conjunction with other technical indicators as part of a larger trading strategy.
█ Giga Kaleidoscope Modularized Trading System
Core components of an NNFX algorithmic trading strategy
The NNFX algorithm is built on the principles of trend, momentum, and volatility. There are six core components in the NNFX trading algorithm:
1. Volatility - price volatility; e.g., Average True Range, True Range Double, Close-to-Close, etc.
2. Baseline - a moving average to identify price trend
3. Confirmation 1 - a technical indicator used to identify trends
4. Confirmation 2 - a technical indicator used to identify trends
5. Continuation - a technical indicator used to identify trends
6. Volatility/Volume - a technical indicator used to identify volatility/volume breakouts/breakdown
7. Exit - a technical indicator used to determine when a trend is exhausted
What is Volatility in the NNFX trading system?
In the NNFX (No Nonsense Forex) trading system, ATR (Average True Range) is typically used to measure the volatility of an asset. It is used as a part of the system to help determine the appropriate stop loss and take profit levels for a trade. ATR is calculated by taking the average of the true range values over a specified period.
True range is calculated as the maximum of the following values:
-Current high minus the current low
-Absolute value of the current high minus the previous close
-Absolute value of the current low minus the previous close
ATR is a dynamic indicator that changes with changes in volatility. As volatility increases, the value of ATR increases, and as volatility decreases, the value of ATR decreases. By using ATR in NNFX system, traders can adjust their stop loss and take profit levels according to the volatility of the asset being traded. This helps to ensure that the trade is given enough room to move, while also minimizing potential losses.
Other types of volatility include True Range Double (TRD), Close-to-Close, and Garman-Klass
What is a Baseline indicator?
The baseline is essentially a moving average, and is used to determine the overall direction of the market.
The baseline in the NNFX system is used to filter out trades that are not in line with the long-term trend of the market. The baseline is plotted on the chart along with other indicators, such as the Moving Average (MA), the Relative Strength Index (RSI), and the Average True Range (ATR).
Trades are only taken when the price is in the same direction as the baseline. For example, if the baseline is sloping upwards, only long trades are taken, and if the baseline is sloping downwards, only short trades are taken. This approach helps to ensure that trades are in line with the overall trend of the market, and reduces the risk of entering trades that are likely to fail.
By using a baseline in the NNFX system, traders can have a clear reference point for determining the overall trend of the market, and can make more informed trading decisions. The baseline helps to filter out noise and false signals, and ensures that trades are taken in the direction of the long-term trend.
What is a Confirmation indicator?
Confirmation indicators are technical indicators that are used to confirm the signals generated by primary indicators. Primary indicators are the core indicators used in the NNFX system, such as the Average True Range (ATR), the Moving Average (MA), and the Relative Strength Index (RSI).
The purpose of the confirmation indicators is to reduce false signals and improve the accuracy of the trading system. They are designed to confirm the signals generated by the primary indicators by providing additional information about the strength and direction of the trend.
Some examples of confirmation indicators that may be used in the NNFX system include the Bollinger Bands, the MACD (Moving Average Convergence Divergence), and the MACD Oscillator. These indicators can provide information about the volatility, momentum, and trend strength of the market, and can be used to confirm the signals generated by the primary indicators.
In the NNFX system, confirmation indicators are used in combination with primary indicators and other filters to create a trading system that is robust and reliable. By using multiple indicators to confirm trading signals, the system aims to reduce the risk of false signals and improve the overall profitability of the trades.
What is a Continuation indicator?
In the NNFX (No Nonsense Forex) trading system, a continuation indicator is a technical indicator that is used to confirm a current trend and predict that the trend is likely to continue in the same direction. A continuation indicator is typically used in conjunction with other indicators in the system, such as a baseline indicator, to provide a comprehensive trading strategy.
What is a Volatility/Volume indicator?
Volume indicators, such as the On Balance Volume (OBV), the Chaikin Money Flow (CMF), or the Volume Price Trend (VPT), are used to measure the amount of buying and selling activity in a market. They are based on the trading volume of the market, and can provide information about the strength of the trend. In the NNFX system, volume indicators are used to confirm trading signals generated by the Moving Average and the Relative Strength Index. Volatility indicators include Average Direction Index, Waddah Attar, and Volatility Ratio. In the NNFX trading system, volatility is a proxy for volume and vice versa.
By using volume indicators as confirmation tools, the NNFX trading system aims to reduce the risk of false signals and improve the overall profitability of trades. These indicators can provide additional information about the market that is not captured by the primary indicators, and can help traders to make more informed trading decisions. In addition, volume indicators can be used to identify potential changes in market trends and to confirm the strength of price movements.
What is an Exit indicator?
The exit indicator is used in conjunction with other indicators in the system, such as the Moving Average (MA), the Relative Strength Index (RSI), and the Average True Range (ATR), to provide a comprehensive trading strategy.
The exit indicator in the NNFX system can be any technical indicator that is deemed effective at identifying optimal exit points. Examples of exit indicators that are commonly used include the Parabolic SAR, the Average Directional Index (ADX), and the Chandelier Exit.
The purpose of the exit indicator is to identify when a trend is likely to reverse or when the market conditions have changed, signaling the need to exit a trade. By using an exit indicator, traders can manage their risk and prevent significant losses.
In the NNFX system, the exit indicator is used in conjunction with a stop loss and a take profit order to maximize profits and minimize losses. The stop loss order is used to limit the amount of loss that can be incurred if the trade goes against the trader, while the take profit order is used to lock in profits when the trade is moving in the trader's favor.
Overall, the use of an exit indicator in the NNFX trading system is an important component of a comprehensive trading strategy. It allows traders to manage their risk effectively and improve the profitability of their trades by exiting at the right time.
How does Loxx's GKD (Giga Kaleidoscope Modularized Trading System) implement the NNFX algorithm outlined above?
Loxx's GKD v1.0 system has five types of modules (indicators/strategies). These modules are:
1. GKD-BT - Backtesting module (Volatility, Number 1 in the NNFX algorithm)
2. GKD-B - Baseline module (Baseline and Volatility/Volume, Numbers 1 and 2 in the NNFX algorithm)
3. GKD-C - Confirmation 1/2 and Continuation module (Confirmation 1/2 and Continuation, Numbers 3, 4, and 5 in the NNFX algorithm)
4. GKD-V - Volatility/Volume module (Confirmation 1/2, Number 6 in the NNFX algorithm)
5. GKD-E - Exit module (Exit, Number 7 in the NNFX algorithm)
(additional module types will added in future releases)
Each module interacts with every module by passing data between modules. Data is passed between each module as described below:
GKD-B => GKD-V => GKD-C(1) => GKD-C(2) => GKD-C(Continuation) => GKD-E => GKD-BT
That is, the Baseline indicator passes its data to Volatility/Volume. The Volatility/Volume indicator passes its values to the Confirmation 1 indicator. The Confirmation 1 indicator passes its values to the Confirmation 2 indicator. The Confirmation 2 indicator passes its values to the Continuation indicator. The Continuation indicator passes its values to the Exit indicator, and finally, the Exit indicator passes its values to the Backtest strategy.
This chaining of indicators requires that each module conform to Loxx's GKD protocol, therefore allowing for the testing of every possible combination of technical indicators that make up the six components of the NNFX algorithm.
What does the application of the GKD trading system look like?
Example trading system:
Backtest: Strategy with 1-3 take profits, trailing stop loss, multiple types of PnL volatility, and 2 backtesting styles
Baseline: Hull Moving Average
Volatility/Volume: Hurst Exponent
Confirmation 1: RSI DEMA as shown on the chart above
Confirmation 2: Williams Percent Range
Continuation: Fisher Transform
Exit: Rex Oscillator
Each GKD indicator is denoted with a module identifier of either: GKD-BT, GKD-B, GKD-C, GKD-V, or GKD-E. This allows traders to understand to which module each indicator belongs and where each indicator fits into the GKD protocol chain.
Giga Kaleidoscope Modularized Trading System Signals (based on the NNFX algorithm)
Standard Entry
1. GKD-C Confirmation 1 Signal
2. GKD-B Baseline agrees
3. Price is within a range of 0.2x Volatility and 1.0x Volatility of the Goldie Locks Mean
4. GKD-C Confirmation 2 agrees
5. GKD-V Volatility/Volume agrees
Baseline Entry
1. GKD-B Baseline signal
2. GKD-C Confirmation 1 agrees
3. Price is within a range of 0.2x Volatility and 1.0x Volatility of the Goldie Locks Mean
4. GKD-C Confirmation 2 agrees
5. GKD-V Volatility/Volume agrees
6. GKD-C Confirmation 1 signal was less than 7 candles prior
Volatility/Volume Entry
1. GKD-V Volatility/Volume signal
2. GKD-C Confirmation 1 agrees
3. Price is within a range of 0.2x Volatility and 1.0x Volatility of the Goldie Locks Mean
4. GKD-C Confirmation 2 agrees
5. GKD-B Baseline agrees
6. GKD-C Confirmation 1 signal was less than 7 candles prior
Continuation Entry
1. Standard Entry, Baseline Entry, or Pullback; entry triggered previously
2. GKD-B Baseline hasn't crossed since entry signal trigger
3. GKD-C Confirmation Continuation Indicator signals
4. GKD-C Confirmation 1 agrees
5. GKD-B Baseline agrees
6. GKD-C Confirmation 2 agrees
1-Candle Rule Standard Entry
1. GKD-C Confirmation 1 signal
2. GKD-B Baseline agrees
3. Price is within a range of 0.2x Volatility and 1.0x Volatility of the Goldie Locks Mean
Next Candle:
1. Price retraced (Long: close < close or Short: close > close )
2. GKD-B Baseline agrees
3. GKD-C Confirmation 1 agrees
4. GKD-C Confirmation 2 agrees
5. GKD-V Volatility/Volume agrees
1-Candle Rule Baseline Entry
1. GKD-B Baseline signal
2. GKD-C Confirmation 1 agrees
3. Price is within a range of 0.2x Volatility and 1.0x Volatility of the Goldie Locks Mean
4. GKD-C Confirmation 1 signal was less than 7 candles prior
Next Candle:
1. Price retraced (Long: close < close or Short: close > close )
2. GKD-B Baseline agrees
3. GKD-C Confirmation 1 agrees
4. GKD-C Confirmation 2 agrees
5. GKD-V Volatility/Volume Agrees
1-Candle Rule Volatility/Volume Entry
1. GKD-V Volatility/Volume signal
2. GKD-C Confirmation 1 agrees
3. Price is within a range of 0.2x Volatility and 1.0x Volatility of the Goldie Locks Mean
4. GKD-C Confirmation 1 signal was less than 7 candles prior
Next Candle:
1. Price retraced (Long: close < close or Short: close > close)
2. GKD-B Volatility/Volume agrees
3. GKD-C Confirmation 1 agrees
4. GKD-C Confirmation 2 agrees
5. GKD-B Baseline agrees
PullBack Entry
1. GKD-B Baseline signal
2. GKD-C Confirmation 1 agrees
3. Price is beyond 1.0x Volatility of Baseline
Next Candle:
1. Price is within a range of 0.2x Volatility and 1.0x Volatility of the Goldie Locks Mean
2. GKD-C Confirmation 1 agrees
3. GKD-C Confirmation 2 agrees
4. GKD-V Volatility/Volume Agrees
]█ Setting up the GKD
The GKD system involves chaining indicators together. These are the steps to set this up.
Use a GKD-C indicator alone on a chart
1. Inside the GKD-C indicator, change the "Confirmation Type" setting to "Solo Confirmation Simple"
Use a GKD-V indicator alone on a chart
**nothing, it's already useable on the chart without any settings changes
Use a GKD-B indicator alone on a chart
**nothing, it's already useable on the chart without any settings changes
Baseline (Baseline, Backtest)
1. Import the GKD-B Baseline into the GKD-BT Backtest: "Input into Volatility/Volume or Backtest (Baseline testing)"
2. Inside the GKD-BT Backtest, change the setting "Backtest Special" to "Baseline"
Volatility/Volume (Volatility/Volume, Backte st)
1. Inside the GKD-V indicator, change the "Testing Type" setting to "Solo"
2. Inside the GKD-V indicator, change the "Signal Type" setting to "Crossing" (neither traditional nor both can be backtested)
3. Import the GKD-V indicator into the GKD-BT Backtest: "Input into C1 or Backtest"
4. Inside the GKD-BT Backtest, change the setting "Backtest Special" to "Volatility/Volume"
5. Inside the GKD-BT Backtest, a) change the setting "Backtest Type" to "Trading" if using a directional GKD-V indicator; or, b) change the setting "Backtest Type" to "Full" if using a directional or non-directional GKD-V indicator (non-directional GKD-V can only test Longs and Shorts separately)
6. If "Backtest Type" is set to "Full": Inside the GKD-BT Backtest, change the setting "Backtest Side" to "Long" or "Short
7. If "Backtest Type" is set to "Full": To allow the system to open multiple orders at one time so you test all Longs or Shorts, open the GKD-BT Backtest, click the tab "Properties" and then insert a value of something like 10 orders into the "Pyramiding" settings. This will allow 10 orders to be opened at one time which should be enough to catch all possible Longs or Shorts.
Solo Confirmation Simple (Confirmation, Backtest)
1. Inside the GKD-C indicator, change the "Confirmation Type" setting to "Solo Confirmation Simple"
1. Import the GKD-C indicator into the GKD-BT Backtest: "Input into Backtest"
2. Inside the GKD-BT Backtest, change the setting "Backtest Special" to "Solo Confirmation Simple"
Solo Confirmation Complex without Exits (Baseline, Volatility/Volume, Confirmation, Backtest)
1. Inside the GKD-V indicator, change the "Testing Type" setting to "Chained"
2. Import the GKD-B Baseline into the GKD-V indicator: "Input into Volatility/Volume or Backtest (Baseline testing)"
3. Inside the GKD-C indicator, change the "Confirmation Type" setting to "Solo Confirmation Complex"
4. Import the GKD-V indicator into the GKD-C indicator: "Input into C1 or Backtest"
5. Inside the GKD-BT Backtest, change the setting "Backtest Special" to "GKD Full wo/ Exits"
6. Import the GKD-C into the GKD-BT Backtest: "Input into Exit or Backtest"
Solo Confirmation Complex with Exits (Baseline, Volatility/Volume, Confirmation, Exit, Backtest)
1. Inside the GKD-V indicator, change the "Testing Type" setting to "Chained"
2. Import the GKD-B Baseline into the GKD-V indicator: "Input into Volatility/Volume or Backtest (Baseline testing)"
3. Inside the GKD-C indicator, change the "Confirmation Type" setting to "Solo Confirmation Complex"
4. Import the GKD-V indicator into the GKD-C indicator: "Input into C1 or Backtest"
5. Import the GKD-C indicator into the GKD-E indicator: "Input into Exit"
6. Inside the GKD-BT Backtest, change the setting "Backtest Special" to "GKD Full w/ Exits"
7. Import the GKD-E into the GKD-BT Backtest: "Input into Backtest"
Full GKD without Exits (Baseline, Volatility/Volume, Confirmation 1, Confirmation 2, Continuation, Backtest)
1. Inside the GKD-V indicator, change the "Testing Type" setting to "Chained"
2. Import the GKD-B Baseline into the GKD-V indicator: "Input into Volatility/Volume or Backtest (Baseline testing)"
3. Inside the GKD-C 1 indicator, change the "Confirmation Type" setting to "Confirmation 1"
4. Import the GKD-V indicator into the GKD-C 1 indicator: "Input into C1 or Backtest"
5. Inside the GKD-C 2 indicator, change the "Confirmation Type" setting to "Confirmation 2"
6. Import the GKD-C 1 indicator into the GKD-C 2 indicator: "Input into C2"
7. Inside the GKD-C Continuation indicator, change the "Confirmation Type" setting to "Continuation"
8. Inside the GKD-BT Backtest, change the setting "Backtest Special" to "GKD Full wo/ Exits"
9. Import the GKD-E into the GKD-BT Backtest: "Input into Exit or Backtest"
Full GKD with Exits (Baseline, Volatility/Volume, Confirmation 1, Confirmation 2, Continuation, Exit, Backtest)
1. Inside the GKD-V indicator, change the "Testing Type" setting to "Chained"
2. Import the GKD-B Baseline into the GKD-V indicator: "Input into Volatility/Volume or Backtest (Baseline testing)"
3. Inside the GKD-C 1 indicator, change the "Confirmation Type" setting to "Confirmation 1"
4. Import the GKD-V indicator into the GKD-C 1 indicator: "Input into C1 or Backtest"
5. Inside the GKD-C 2 indicator, change the "Confirmation Type" setting to "Confirmation 2"
6. Import the GKD-C 1 indicator into the GKD-C 2 indicator: "Input into C2"
7. Inside the GKD-C Continuation indicator, change the "Confirmation Type" setting to "Continuation"
8. Import the GKD-C Continuation indicator into the GKD-E indicator: "Input into Exit"
9. Inside the GKD-BT Backtest, change the setting "Backtest Special" to "GKD Full w/ Exits"
10. Import the GKD-E into the GKD-BT Backtest: "Input into Backtest"
Baseline + Volatility/Volume (Baseline, Volatility/Volume, Backtest)
1. Inside the GKD-V indicator, change the "Testing Type" setting to "Baseline + Volatility/Volume"
2. Inside the GKD-V indicator, make sure the "Signal Type" setting is set to "Traditional"
3. Import the GKD-B Baseline into the GKD-V indicator: "Input into Volatility/Volume or Backtest (Baseline testing)"
4. Inside the GKD-BT Backtest, change the setting "Backtest Special" to "Baseline + Volatility/Volume"
5. Import the GKD-V into the GKD-BT Backtest: "Input into C1 or Backtest"
6. Inside the GKD-BT Backtest, change the setting "Backtest Type" to "Full". For this backtest, you must test Longs and Shorts separately
7. To allow the system to open multiple orders at one time so you can test all Longs or Shorts, open the GKD-BT Backtest, click the tab "Properties" and then insert a value of something like 10 orders into the "Pyramiding" settings. This will allow 10 orders to be opened at one time which should be enough to catch all possible Longs or Shorts.
Requirements
Inputs
Confirmation 1: GKD-V Volatility / Volume indicator
Confirmation 2: GKD-C Confirmation indicator
Continuation: GKD-C Confirmation indicator
Solo Confirmation Simple: GKD-B Baseline
Solo Confirmation Complex: GKD-V Volatility / Volume indicator
Solo Confirmation Super Complex: GKD-V Volatility / Volume indicator
Stacked 1: None
Stacked 2+: GKD-C, GKD-V, or GKD-B Stacked 1
Outputs
Confirmation 1: GKD-C Confirmation 2 indicator
Confirmation 2: GKD-C Continuation indicator
Continuation: GKD-E Exit indicator
Solo Confirmation Simple: GKD-BT Backtest
Solo Confirmation Complex: GKD-BT Backtest or GKD-E Exit indicator
Solo Confirmation Super Complex: GKD-C Continuation indicator
Stacked 1: GKD-C, GKD-V, or GKD-B Stacked 2+
Stacked 2+: GKD-C, GKD-V, or GKD-B Stacked 2+ or GKD-BT Backtest
Additional features will be added in future releases.

NSDT Lattice WebThis script creates a "web" by connecting different points of candles. All configurable by the trader.
There are 4 basic parts to a candle:
Open, High, Low, and Close
With this script, you can connect any point of one candle in the past to any point of another current candle.
For example:
High to High, High to Low, High to Open, High to close
Low to High, Low to Low, Low to Open, Low to Close
Open to High, Open to Low, Open to Open, Open to Close
Close to High, Close to Low, Close to Open, Close to Close
The script will change the line colors based on whether the current plot is higher or lower than the previous plot.
Try out different connection points to see what works for you. Connecting High to High and Low to Low, might easily show you when the market is making higher highs or lower lows, indicating a potential movement.
Run it on replay at a higher speed and see how it may potentially help identify area of congestion or trends.

Bar metrics / quantifytools— Overview
Rather than eyeball evaluating bullishness/bearishness in any given bar, bar metrics allow a quantified approach using three basic fundamental data points: relative close, relative volatility and relative volume. These data points are visualized in a discreet data dashboard form, next to all real-time bars. Each value also has a dot in front, representing color coded extremes in the values.
Relative close represents position of bar's close relative to high and low, high of bar being 100% and low of bar being 0%. Relative close indicates strength of bulls/bears in a given bar, the higher the better for bulls, the lower the better for bears. Relative volatility (bar range, high - low) and relative volume are presented in a form of a multiplier, relative to their respective moving averages (SMA 20). A value of 1x indicates volume/volatility being on par with moving average, 2x indicates volume/volatility being twice as much as moving average and so on. Relative volume and volatility can be used for measuring general market participant interest, the "weight of the bar" as it were.
— Features
Users can gauge past bar metrics using lookback via input menu. Past bars, especially recent ones, are helpful for giving context for current bar metrics. Lookback bars are highlighted on the chart using a yellow box and metrics presented on the data dashboard with lookback symbols:
To inspect bar metric data and its implications, users can highlight bars with specified bracket values for each metric:
When bar highlighter is toggled on and desired bar metric values set, alert for the specified combination can be toggled on via alert menu. Note that bar highlighter must be enabled in order for alerts to function.
— Visuals
Bar metric dots are gradient colored the following way:
Relative volatility & volume
0x -> 1x / Neutral (white) -> Light (yellow)
1x -> 1.7x / Light (yellow) -> Medium (orange)
1.7x -> 2.4x / Medium (orange) -> Heavy (red)
Relative close
0% -> 25% / Heavy bearish (red) -> Light bearish (dark red)
25% -> 45% / Light bearish (dark red) -> Neutral (white)
45% - 55% / Neutral (white)
55% -> 75% / Neutral (white) -> Light bullish (dark green)
75% -> 100% / Light bullish (dark green) -> Heavy bullish (green)
All colors can be adjusted via input menu. Label size, label distance from bar (offset) and text format (regular/stealth) can be adjusted via input menu as well:
— Practical guide
As interpretation of bar metrics is highly contextual, it is especially important to use other means in conjunction with the metrics. Levels, oscillators, moving averages, whatever you have found useful for your process. In short, relative close indicates directional bias and relative volume/volatility indicates "weight" of directional bias.
General interpretation
High relative close, low relative volume/volatility = mildly bullish, bias up/consolidation
High relative close, medium relative volume/volatility = bullish, bias up
High relative close, high relative volume/volatility = exuberantly bullish, bias up/down depending on context
Medium relative close, low relative volume/volatility = noise, no bias
Medium relative close, medium to high relative volume/volatility = indecision, further evidence needed to evaluate bias
Low relative close, low relative volume/volatility = mildly bearish, bias down/consolidation
Low relative close, medium relative volume/volatility = bearish, bias down
Low relative close, high relative volume/volatility = exuberantly bearish, bias down/up depending on context
Nuances & considerations
As to relative close, it's important to note that each bar is a trading range when viewed on a lower timeframe, ES 1W vs. ES 4H:
When relative close is high, bulls were able to push price to range high by the time of close. When relative close is low, bears were able to push price to range low by the time of close. In other words, bulls/bears were able to gain the upper hand over a given trading range, hinting strength for the side that made the final push. When relative close is around middle range (40-60%), it can be said neither side is clearly dominating the range, hinting neutral/indecision bias from a relative close perspective.
As to relative volume/volatility, low values (less than ~0.7x) imply bar has low market participant interest and therefore is likely insignificant, as it is "lacking weight". Values close to or above 1x imply meaningful market participant interest, whereas values well above 1x (greater than ~1.3x) imply exuberance. This exuberance can manifest as initiation (beginning of a trend) or as exhaustion (end of a trend):
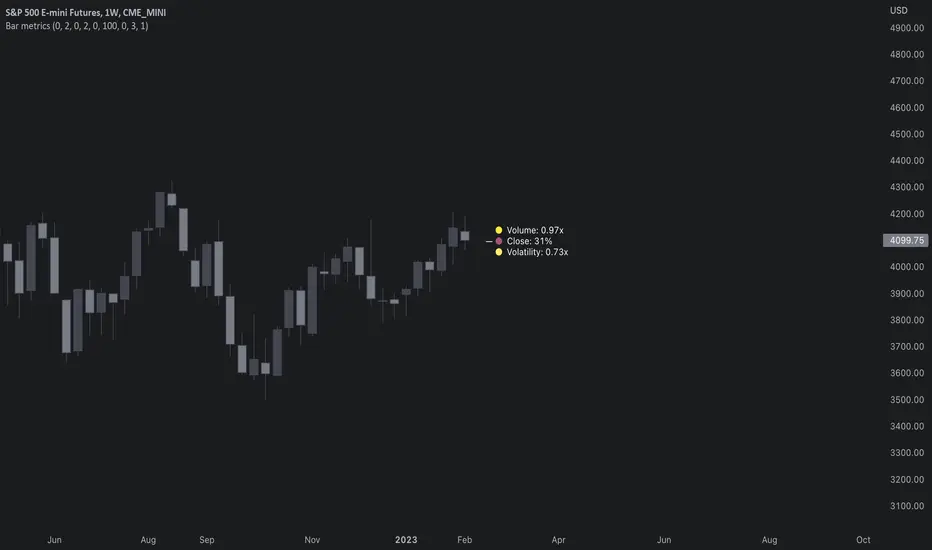
Vision Essentials - RSIVision Essentials - RSI is the first indicator from our essentials pack we have planned. It's our twist on the highly popular RSI (Relative Strength Index) Oscillator.
What makes this indicator different?
Based on community feedback we provided users with a visual + adjustable oversold and overbought range to avoid having to redraw boxes during session. Adjusting the settings will update the box positioning on the chart to match.
We utilize custom inputs to allow users to select HA based open, high, low, and close as well as the usual open, high, low, close, hl2, hlc3, and ohlc4 inputs (more coming soon)
The indicator will track the values of the recent high & low points of the RSI based on the distance setting. These values are displayed as text floating at the end of the pane, as well as plotted lines for a visual of the past and current high/low points
The user has complete customization of the color schemes used by: The oversold box, the overbought box, the RSI lower color, the RSI higher color, the recent low color, the recent high color, and the text color. The user can also control the distance that is utilized for finding the recent High & Low points.
How do I use this indicator?
To start using this indicator simply apply it to your chart. We use pre-defined values matching the most common RSI configuration however, you're encouraged to view the settings to fully understand how to adjust the various settings as well as learn how the indicator changes under each individual setting.
RSI Source - This is the input source the RSI calculation is based on. Close is the most common, and default which utilizes the closing price of candles
RSI Length - This setting provides the indicator the length (distance) you want the RSI outlook to be based on. The most common is a 14-day timeframe, but keep in mind that the value of 14 on a 15min chart isn't the same as the value of 14 on a 1day chart. The simple way to view this setting is to consider how many candles back you want the calculation to be based on
RSI Oversold - This setting is considered the "low" level of the RSI. 30 is the most common setting. The lower the RSI, the more momentum that is considered to be in place
RSI Overbought - This setting is considered the "high" level of the RSI. 70 is the most common setting. The higher the RSI, the more momentum that is considered to be in place
High/Low Distance - This setting defines the number of candles back that the indicator will look to determine the recent high/low values
Visual Style - Gradient provides you with a gradient fill between 2 RSI lines. The first is the root RSI based on your RSI settings, and the second is a doubled value which creates the fill gap. Gradient + Highlight is the same as Gradient, but enables coloring on the root RSI edge of the gradient. Highlight Only provides you with a single line based on your RSI settings
Highlight Color - This setting controls the color of your root RSI plot when using one of the highlight based Visual Styles
RSI Lower - This setting controls the color used by the indicator when the RSI value is on the lower end of the spectrum
RSI Higher - This setting controls the color used by the indicator when the RSI value is on the higher end of the spectrum
Recent Low Color - This setting controls the color used by the indicator for plotting the recent low line
Recent High Color - This setting controls the color used by the indicator for plotting the recent high line
Text Color - This setting controls the text color used for the recent high low values at the end of the pane

EP/SL and ratio calculationExplanation of the indicator
The first question is - what is shown here at all. Generally, the indicator calculates order prices depending on the data found in the chart. The order is based on the lowest low (for a long) of the bounce and the high of the last candle. For a short it is based on the highest high and on the low of the last candle. There is no value for you, if you don’t do swing trading using trend lines on your chart.
All values shown are no financial advise - you are responsible for all your trades.
The indicator looks for the lowest low of the last days. How many days back to be searched can be configured in the settings. The lowest low is marked with the flag - the date and price is displayed there.
The high of the last candle is read out and based on this the entry price is calculated. On the green line are the EP percentages with which is calculated, the entry price and also the high of the last candle displayed.
On the line there is a green (or red) triangle, which indicates the trading direction. More about the direction can be found below in the settings.
Based on the lowest low (or in case of short the highest high) the stop loss is calculated. Also here the percentage and the price is given.
The lines labeled R1 to R5 are the prices of the respective ratios. The lines are 40 time units long (in the standard setting) and thus one can read off the ratio, which the trade would reach after approx. 8 weeks, over the trend lines and their intersection point at the end of the ratio lines.
The orange line marks the point at which we would be 10% above the entry price (or below the entry price for a short).
In general, the calculations are equivalent for short, the marker of the highest high is displayed.
The capital and the number of shares to be traded are not publicly displayed on the chart. The complete calculation is visible when you move the mouse over the text of the entry price.
In this small pop-up window you can see with which capital the calculation was done. The capital should be updated daily in the settings. Furthermore, you can see how many shares can be traded with this capital, taking into account the 1% portfolio risk. It is again the entry price and a proposal for a stop limit price (percentages also configurable) displayed. The price for the 3 ratio (take profit) and also the price for the stop loss can be read here. So actually everything that is necessary for the creation of the order.
Settings
The indicator now has a lot of settings and options. I have also built-in indicators such as EMA and JMA to have all the indicators necessary for me - with the free TV. Some things can also be changed under "Style", but I don't want to go into the things under "Style" here, just the basic settings.
Settings of the main indicator
With the checkmark at "Main Indicator" all lines etc. can be switched off without the other indicators (EMA, JMA) disappearing.
Capital:
Here you can set your daily capital (from paper trading or from the real money deposit). This is used to calculate the number of shares.
Search last bounce in last x candles:
Here you can influence how many candles the tool should look into the past to search for the lowest (long) or highest (short) candle. Default is 10, but sometimes shorter or longer periods make sense. It is also possible to tune a bit here and e.g. with "0" make the calculation of the SL based on the low/high of the last candle. Which low (long) or high (short) is taken, is always evident with the above described flag.
go back x candles for calculation:
If the calculation is not to be made on the basis of the last candle, but e.g. the one before last, this can be adjusted here. Everything is adapted with, thus e.g. also the Stochastic of this time is used for the direction. One can go back in time and reconstruct the calculation at that time.
EP percent:
Specifying how far the EP should be from the high (long)/low (short) of the last candle.
EP limit percent:
Specify how far the EP limit should be from the EP.
SL percent:
Specifying how far the SL should be from the lowest low (long)/highest high (short).
direction mode:
here is set in which way the indicator should be directed long or short. The stochastic used here has the settings 8-5-5. k is the blue line and d is the red line of this stochastic.
Stoch k>d = long automatic, blue line above the red line for long calculation
Stoch k<50% = long automatic, blue line below 50% for long calculation
long no automatic, always long calculation
short no automatic, always short calculation
ignore last candle if market is open:
Normally one calculates at closed market, thus on the finished candles. If you want to calculate with an open market or if you want to make sure that the indicator is not constantly running back and forth after the market has opened, you can automatically ignore the last candle (i.e. calculate on the second to last candle) if the market is open. If the market is closed, the last candle is always taken. If turned off, the last candle is always taken even if the market is open.
use close price for EP (instead of high/low):
You can adjust the EP calculation here to take the close price instead of the high/low of the last candle. This is not the usual strategy, but if there are long wicks/luns and you are quite sure with the trading direction, this can improve the ratio significantly.
Ratio lines length (bars):
The length of the lines. You can change here for 3M/6M trades to 80 time units.
Text color:
Color of the text (default is gray, this is kind of useful for white and black background).
Line color R-lines:
Color of the ratio lines (default is gray)
10% color:
Color of the 10% line (default orange)
Additional indicators settings
EMAs:
Here you can switch on/off all EMA lines
xx EMA Length:
Configuration of the individual EMA lines to be displayed. At 0 the line is switched off, colors are configured at the style.
JMA:
Here you can additionally display the JMA. Also its colors can be configured at Style.
JMA length:
JMA length, default 20, phase is fixed at 50 and power is fixed at 2.

coates moving averages (cma)This indicator uses three moving averages:
2 period low simple ma
2 period high simple ma
9 period least squares ma
The trend is determined by the angle of the moving averages, current close relative the the 9 least squares ma (lsm) and the current close relative to the prior two periods high and low.
When there are consecutive closes inside the prior two candles high and low then a range is signaled:
In ranges the buy zone is between the lowest low and the lowest close of the current range. The sell zone is between the highest high and the highest close. The zones are adjusted as long as the new close is within the prior two candles range:
When price closes above the 2 high ma and the 9 lsm then a bull trend is signaled if all moving averages are angled upward (as seen at #4 in the chart above and #1 the chart below ). If the 9 lsm and / or the 2 low ma continue to angle downward, following a close above the 2 high ma and 9 lsm, then a prolonged range or reversal is expected (#2 in the chart below):
During a bull trend the buy zone is between the 2 low ma and the 9 lsm. The profit target is the 2 high ma:
During dip buying opportunities price should resist closing below the 9 lsm. If there is one close below the 9 lsm then it is a canary in the coalmine that tells us to proceed with caution. This will often signal a range, based on the conditions outlined above. To avoid a prolonged range, or reversal, price needs to immediately react in the direction of the prevailing trend:
If the moving averages are angled down and the most recent close is below the 2 low ma and 9 lsm then trend is fully bearish:
During a bear trend the short zone is between the 2 high ma and 9 lsm. The profit target is the 2 low ma:
When the 2 high ma angles down and the 2 low ma angles up while price closes inside both mas then it indicates a cma squeeze:
Volatility is expected in the direction of the breakout following the squeeze. In this situation traps / shakeouts are common. If there is a wick outside the cma, with a close inside, then it indicates a trap / shakeout. If there is a close outside the 2 high / low ma then it signals a breakout.
A trend is considered balanced when the 9 lsm is roughly equidistant from the 2 low and 2 high mas. If the 9 lsm crosses the 2 high or 2 low ma then it signals exhaustion / imbalance.
For a stop loss I use the prior three periods low, for bull trends, and the prior three periods high for bear trends. I would expect other reliable stops, such as the parabolic sar or bill williams fractal, to be effective as well. The default moving averages should be very effective on all timeframes and assets classes, however this indicator was developed for bitcoin with a focus on higher timeframes such as the 4h, daily and weekly.
As with any other technical indicator there will be bad signals. Proceed with caution and never risk more than you are willing to lose.
